ALTE DOCUMENTE |
“TRANSILVANIA” UNIVERSITY OF BRASOV
FACULTATY OF WOOD INDUSTRY
DIPLOMA PROJECT
Enunciation of the given thema:
Technical and economical study regarding the posibility of implementation of wood internal scanning in wood industry (hardwoods timber industry)
Subjects that need to be approached:
Presentation of the existing scanning technologies
Parameters of existing scanning technologies
Presentation of the flow sheet for a timber processing unit
Presentation of a possible flow sheet for a timber processing unit with the scanning operation included.
Calculation of benefits in case of implementation of wood scanning operation for timber production: - costs of wood scanning device
- calculation of the increased value for the produced timber
- calculation of the processing costs
Analization of efficiency of implementation of a wood scanning operation for the timber factory of SC Forex SRL Ghimbav
CAP.I
PRESENTATION OF THE
EXISTING SCANNING TECHNOLOGIES
I.1. INTRODUCTION.
MOTIVATION FOR THE THEMA SELECTION
The present state of facts on the wood industry market reveal us some directions that the industry is following worldwide. The wood industry mechanization and technologization is developing continously reaching levels which could be hardly forgone 20-30 years ago. This is a result of more factors, but is mainly done because of the need to produce of a high amount of high guality wood products having a price restricted by the existing market.
Ourdays some of the moust important parameters which influence the product price are production costs (labor costs) and raw material costs. Raw material costs are always highly influenced by the raw material availability.
We can observe a increasing need for wooden products worldwide but in the same time we can see the decreasing amount of round wood in many reagions of the world. This developes the need for the wood industry to focus it’s attention on the optimization of wood processing and obtaining the maximum quality and quantity results from the available amount of wood.
Many researches tried to optimize the possibility of obtaining of the maximum quantities of timber from the available round wood. In this case the efficiency index was grown and good results where obtained.
I have choosen to present the availability and advantages of wood scanning technology because I consider that this is a great method to improve the quality of the obtained products. This products will have at the base the same round wood which is already used in the timber production thus many andvantages can be appear.
I.2 SUMMARY PRESENTATION
OF SOME OF THE WOOD INTERNAL DEFECTS AND FEATURES THAT CAN BE DETECTED BY MEANS OF COMPUTER TOMOGRAPHY
The term defect in the wood industry refers to any irregularity, imperfection or deviation from normal wood quality that make the wood unsuitable or less desirable for a specific use. Certain defects such as knots and bark pockets arise due to irregularities of tree growth, whereas cracks and decay arise due to cutting of the wood or invasion by foreign organisms.
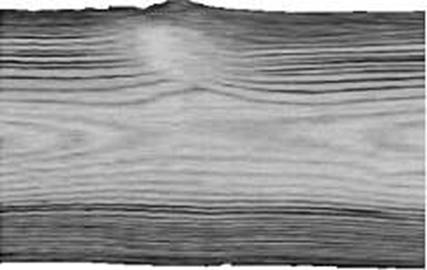
One of the moustly proceesed hardwood species in Romania is beech, fagus silvatica L.. For the European Beech wood resource the inhomogeneous discoloration red heartwood (red core) is very common Red heartwood significantly restricts the log quality of beech stems and end products and leads therefore to severe economic losses. The overall scientific and technical objectives of the researchers are to optimise the processing of beech logs containing red heartwood, to develop grading devices for red heartwood timber and to develop high-value products of red heartwood.
Beech trees of larger dimensions are capable of forming coloured heartwood, which is usually developed as red heart. The occurrence of larger red hearts reduces the value of beechwood considerably: red heartwood is poorly suitable to serial production of appearance products owing to its heterogeneity and instability in colour and appearance structure. Furthermore, tyloses and heartwood substances affect impregnation and drying properties.
Variability of red heart occurrence and shape is high. In stem-axial direction, red heart is often spindle-shaped. The spindle can reach from the felling cut to the crown base, but it can be located somewhere in between as well. In stem radial-direction, red heart does usually not coincide with the annual rings, but appears cloudy and composed of several formation zones.
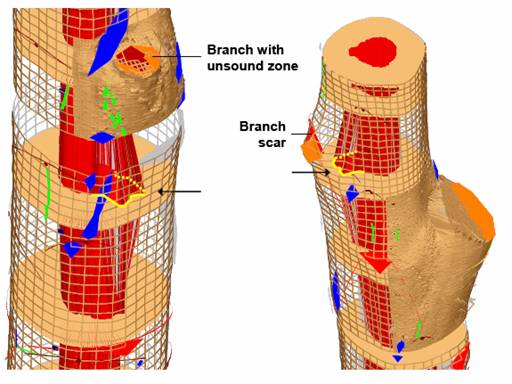
Fig.1 Bulging of the reed heart (arrows) towards a dead branch (left image) and a branch scar (right image) (Holger Wernsdorfer, 2005)
Other wood defects which occur very much and which have a great influence on timber quality are knots. A knot is a particular type of imperfection in a piece of timber, which reduces its strength. A knot is actually a portion of a side branch (or a dormant bud) included in the wood of the stem or larger branch. The included portion is irregularly conical in shape (hence the roughly circular cross-section) with the tip at the point in stem diameter at which the plant’s cambium was located when the branch formed as a bud. Within a knot, the fiber direction (grain) is up to 90 degrees different from the fibers of the stem, thus producing local cross grain.
During the development of a tree, the lower limbs often die, but may persist for a time, sometimes years. Subsequent layers of growth of the attaching stem are no longer intimately joined with the dead limb, but are grown around it. Hence, dead branches produce knots which are not attached, and likely to drop out after the tree has been sawn into boards.
In grading lumber and structural timber, knots are classified according to their form, size, soundness, and the firmness with which they are held in place. This firmness is affected by, among other factors, the length of time for which the branch was dead while the attaching stem continued to grow.
Knots materially affect cracking (known in the industry as checking) and warping, ease in working, and cleavability of timber. They are defects which weaken timber and lower its value for structural purposes where strength is an important consideration. Knots tend to distort the normal growth rings in the tree trunk. Due to the higher density of cells within a knot, it is characterized by high gray-levels in the CT image. Most knots have an elliptical cross section.
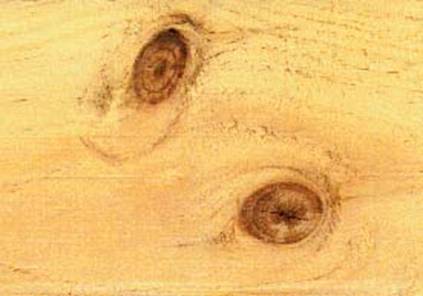
Fig.2 Knots
Another defect that can be easily detected using wood scanning is wet rot of logs. Rot would appear to be an oxymoronic term seemingly indicating decay of a substance.
Rot is actually a fungal attack which is preferentially removing cellulose and hemicelluloses from the timber leaving a brittle matrix of modified lignin. Eventually the decay can cause instability and collapse in wood.
Regions in the tree trunk which are invaded by decay-causing organisms result in decay pockets. Since decayed wood has a decreased amount of cellulose and lignin, it has a lower material density than normal wood and shows up darker when compared to normal wood. The material density of the decay pocket bears a direct relation to the extent of decay.
Cracks and holes have the lowest material density (since they are comprised of air), and so this are very easy to distinguish by means of computer thomography.
Not only wood defects can be easily detected using thomography but also some important wood features can be determined. One of these can be the ring structure. The ring structure is composed of alternating layers of late-wood and earlywood. Since latewood is composed of smaller size cells it has a higher density than earlywood and appears brighter in the CT images. The ring structure can be modeled as a series of concentric ellipses in the absence of defects. Certain defects such as knots distort the normal ring structure. Thus, if an image region has several broken and/or distorted rings, it may be deemed to contain potential defects.
Also bark can be easy recognized by means of computer thomography. The bark tissue surrounding the log cross section has a higher material density due to higher content of moisture and inorganic minerals. Hence, it shows up as a bright ring surrounding the log interior in a CT image slice.
Bark pockets are a result of small amounts of bark tissue embedded in the wood of the tree trunk. Moisture pockets are a result of high concentration of water in certain regions of the tree trunk. Both, bark and moisture pockets, for reasons cited earlier, are characterized by high material density and therefore exhibit high gray-levels in the CT image.
More than that the wood scanning can replace the metal detection operation providing from this point of view another advantage. It can detect not only metals but also any other material which is inside of the log (like stones, plastics) that can be a damage for the cutting process.
I.3. PRESENTATION OF COMPUTER TOMOGRAHPY TECHNOLOGY
Functioning principle for computer tomography (CT) technology
Computer tomography functioning principle is based on the measurement of diferent absorbtion of X-ray from diferent materials.
X-ray radiation passing through an object travels in a straight line, and is attenuated by the structure within the object. Some characteristics of this structure can be inferred from the way it attenuates radiation. The attenuation caused by each small volume of space that lie along the radiation’s path can be represented as a linear equation whose variables represent the linear absorption of these volumes. The constant in this linear equation is the amount of radiation measured at a detector. A non-destructive way to infer the structure of an object as is characterized by x-ray attenuation is to determine the linear absorption of each of the small volumes comprising the object. If one illuminates these volumes from many different directions, recording the amount of radiation detected along many straight line paths, the result can be expressed as a set of simultaneous linear equations. If enough directions are used and enough recordings are taken the resulting set can be solved to yield the linear absorption of each small volume within the object. The principle functioning for a x-ray tomograph is presented in Fig.3
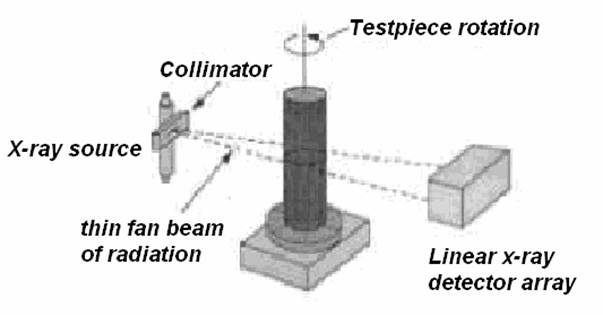
Fig.3 Principle of operation for a x-ray thomography unit
The above represents the basis for x-ray computed tomography (CT). To simplify the calculations CT machines usually move the source and detector around in a plane, recording measurements at preselected locations. The simplification that results is that one need only be concerned with the small volumes that intersect the plane. This markedly reduces the number of variables in the linear equations and, hence, markedly reduces the computational complexity of the „reconstruction” process. This „slice” shows the internal structure of the object along this intersection of this object with the „imaging” plane. The first application of CT was in medicine [1]. More recently the technique has been used in other nonmedical environments. The impact of CT in radiology, diagnostic medicine and non-destructive testing has been revolutionary.
The obtained images are strongly influenced by the density distribution in the tested sample, in our case the logs. Because of the small density diference between wather and wood the contrast is not so significat in case of logs having high moisture content. On the other hand dry wood or half-dry wod can give us very articulately images. (Kucera, 1997).
1.4 PRESENTATION OF NUCLEAR MAGNET RESONANCE TOMOGRAPHY TECHNOLOGY
Functioning principle for nuclear magnet resonance (NMR) technology
The magnet resonance tomography requires the existence of an powerful artificial magnetic field in which the spins of wather H protons align.The magnetic resoance signal, for the image, will be obtained by application of an short radio frequence impuls.
Magnetic resonance imaging (MRI) can be used to determine the free water within a wooden specimen and provides excellent and spatial high resolution information about the morphology and pathology of fresh wood samples in a non-invasive manner (Kucera 1986). Although MRI is most commonly used for medical applications, it has also been successfully employed for imaging wood samples. In MRI applications the image contrast is mainly influenced by the density of protons and by relaxation times (Tx and T2) (Miiller and Bammer 1998). Due to the different decay of transverse magnetization (T2 determined) of the pools of free and bound protons as well as of the pool of protons bound in polymeric molecules (lignin, hemicellulose and cellulose), only the signal emerging from the free proton pool can be detected with conventional MRI systems (Araujo et al. 1992). Hence, MRI is only practicable if the moisture content (MC) of the specimen is above the fiber saturation point (FSP).
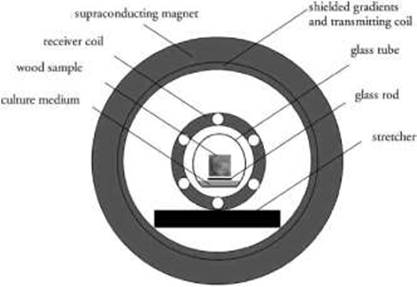 |
scanning a wood sample
The posibility of internal logs defect identification increases in the same way in which moisture content of the logs increases, and behaves exactly opposed to CT regarding moisture content of logs.
In regard to the study of different material properties showes the MRI a significant higher flexibility than CT. This is based on the fact that in case of MRI the signal appearance is influenced by totally different Factors. By means of small variance of scaning frequences respectively of scaning acquisition can one obtain different image contrasts.
1.5 COMPARISON BETWEEN THE ADVANTAGES AND DISADVANTAGES OF CT AND NMR FOR WOOD INDUSTRY APPLICATION
A nondestructive way to study internal log structure is to use either MRI or CT systems to image the internal structure of logs. Both of these systems have their advantages and disadvantages
There are a number of reasons for wanting to concentrate on CT imagery. First, CT imaging systems are less expensive than MRI units and will probably stay so well into the future. CT units do not require the expensive superconducting magnet required by MRI units. Next, CT units are seemingly 'safer' to use in the sawmill or veneer plant. The magnetic field required by MRI units can pull any magnetic material out of a log as it is being imaged. If this happens serious damage to the superconducting magnet would most certainly occur. The magnetic field induced around the 'outside' of the magnet is also very intense. Care would have to be taken not to get any iron or steel tools too close to the MRI unit or they to could be drawn toward the superconducting magnet.
Still we need to mention also the restrictions of CT and the advantages of MRI. In case of CT we can obtain good image results only to a point of 30% moisture content, as for MRI this is aproximately the lower limit from which the scaning provides us with good image results. This fact can be seen different for sawmill to sawmill. Some timber producers do not have the necesar log stock to be able to proces logs having a lower moisture content and in this case MRI would be the only method that could be applied. However it is recommended to process into timber logs having a lower moisture degree. Doing this the timber producers will be able to reduce the drying costs and to produce a final product at a lower price. Many companies apply this method so we can say that for these producers the CT technology can be better applied for log scaning.
I.6 POSSIBILITIES AND PROCEDURES
OF COMPUTER TOMOGRAPHY UTILIZATION
IN WOOD SCIENCE AND INDUSTRY
Before computed tomography (CT) scanning can be applied in industrial operations, we need to automatically interpret scan information so that it can provide the saw operator with the information necessary to make proper sawing decisions. Automatic methods for analyzing data from scanning devices must be developed. A system for locating and identifying internal defects in hardwood logs using CT imagery can be conceptually divided into three components: a CT scanner based image acquisition system, a low-level module for image segmentation, and a high-level module for defect recognition. The processing steps involved in this system include CT data collection, image segmentation, three-dimensional volume growing, and a rule-based expert system for defect recognition. To date, progress has been made on all these processing steps though the work on developing a rule-based expert system is really just getting underway.
While industrial scanner development is actively pursued, we also need to develop the necessary image interpretation software to automatically recognize internal log features and to present this information to the sawyer in a useful manner
Many types of algorithms are studied in and reserached in order to be able to make clear distinction between healthy wood and wood defect like knots, resin pockets, fungal attacks, reaction wood and others.
Bryant and Funt (1987) elaborated the first algorithm which could be able to recognize wooden knots by means of density distribution in wood. The wood density can be determined for a wett or respectively dry sample by means of computed tomography with a tolerance of about +3/-3% depending on moisture content. Because of the small difference between wather and wood (ρ=1 respectively 1.5 g/cm³ ) there are regions considering a log cross section where a exact determination can not be done. From these reson defects like resin pockets or reaction wood can be hardly identify in the sapwood.
For some resionous species like spruche and fir which have a high zone of moisture transport considering the cross section, the utilization of computer tomography for internal defects recognition is problematic.
In Sweden at the Techincal Univeristy of Lulea a high number of spruce and pine logs where scanned and then cross cutted. The surface obtained by sawing was photographed and compared with the images obtained by computed tomography connections where done between these two types of images. In this way an important data base was obtained. These is called „Swedish Stem Bank”, can be used for further application of CT in industry and was developed by the scientists Grundberg, Grönlund, Öhman and the romanian Chiorescu S.
Schmoldt et al (2000) have elaborated a atificial neural network of recognition and identification of internal defects of wood based on the CT images. This method is capable to identify all internal defects that can be recognized by visual examination of the computer tomography images. Depending on the specie by this method there can be achieved a recognition rate of internal defect that can reach an accuracy of 98 %. This system was studied especially for hardwoods, where the heartwood percentage is higher than for softwoods. Because of this the processing of images and the defect recognition process can be done with more succes.
These approach tries to automatically label features in CT images of hardwood logs in order to classify each pixel individually using a back-propagation artificial neural network (ANN) and feature vectors that include a small, local neighborhood of pixels and the distance of the target pixel to the center of the log.
While other approaches tried to separate the tasks of segmentation and region labeling, this approach operates using local, pixel neighborhoods primarily, and effectively combines segmentation and labeling into a single classification step. The feed-forward artificial neural network (ANN) has been trained to accept CT values from a small 2-dimensional (2-D) or 3-dimensional (3-D) neighborhood about the target pixel, and then assigns to each pixel a particular class label. In order to accommodate different types of hardwoods, a histogram-based preprocessing step normalizes CT density values prior to ANN classification. Morphological postprocessing is used to refine the shapes of detected image regions. This approach avoids the limitations of previous approaches, that is, accuracy can be evaluated quantitatively, defect labeling can be accomplished in real time, and texture information is utilized in the segmentation-classification step.
Species-dependent classifiers and species-independent classifiers for different neighborhoods in CT images where developed. Both 2-D and 3-D neighborhoods have been considered. All of these classifiers contain the same modules, which are: (1) a preprocessing module, (2) an ANN-based classifier, and (3) a post-processing module. The preprocessing module separates wood from background and internal voids, and normalizes the CT density values. The ANN classifier labels each pixel of the image. The post-processing step removes some of the spurious misclassifications. The major difference between the various classifiers is that they are trained with different types of input features and have different sets of ANN weights.
Preparation module. Background segmentation
Background segmentation, which separates the wood region (foreground) from the background and internal voids, is the first objective of the preprocessing module. This step eliminates portions of the image from further analysis which, in turn, simplifies the classification procedure and decrease the classification time. Background thresholding can be accomplished either statically or dynamically.
Normalization
Normalizing CT image values is the second objective of the preprocessing module. The values in CT images are directly related to the density of the object. Because different species and different logs vary in densities, somewhat different ranges of CT values can result. Histogram normalization translates the original CT image values into new values without disturbing the invariant associations that internal log features have with particular regions of the CT histogram. These associations seem to be consistent across many different species of logs in the green state.
ANN Classifiers
The ANN classifier is the seminal part of this classification system. back-propagation neural networks were chosen because their documented effectiveness for pattern-matching problems, and their relative ease of use. Using an ANN, each non-background pixel is labeled. This section describes the procedure for generating a classifier, which includes extracting the input features for classification from the CT images and constructing the neural networks for 2-dimensional and 3-dimensional analysis.
Feature extraction
Selecting useful features for an ANN is extremely important because they determine how well the classify learns and consequently how it will perform in the future. In this work, the features of each pixel that were extracted from a CT image are the histogram-normalized values of the pixels. These pixels belong to the neighborhood of the pixel under consideration (the target pixel). For 2-D analysis, a pixel's neighborhood contains the pixels within a 5 x 5 window; for 3-D analysis, its neighborhood contains the pixels within a 3 x 3 x 3 window, i.e. including 3x3 windows from adjacent CT images. Additionally, because some defects, such as splits, are near to the center, and some of them, such as bark and sapwood, are close to the outside edge of the log, the distance from the center of the log to the target pixel is also used as a feature. This distance measure contains contextual (or global) information that can improve classification. The neighborhood of a pixel under consideration for 2-D and 3-D analysis is shown in Figure 4.
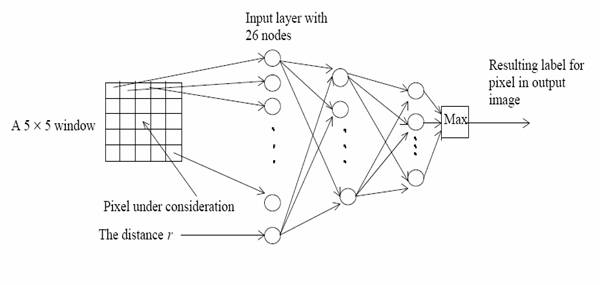
Fig. 4 ANNs containing a 2-D window illustrate the network topology and relationship of input images to output classifications
The top left pixel in (a) is the input of the first node in the 2-D ANN
The distance r is the last input to the ANN in both cases.
Post-processing
Because classification features are based primarily on local neighborhoods, spurious misclassifications tend to occur at isolated points. A post-processing module is used to remove these small regions, and therefore improve overall system performance. The module includes two mathematical morphological operations: erosion and dilation.
After passing though an ANN classifier, a CT image is labeled and treated as a gray-level image. Then the image is post-processed by the morphological operations of erosion followed by dilation using a 5-point structuring element. In a CT image, splits appear close to the center of a log image, and their appearance after classification is a narrow line. If a split is post-processed, it is often deleted by the erosion operation. Hence, for all classifiers in our study, an entire image is not post-processed, only the outer regions of the log are post-processed. The range of the post-processed region of an image is currently selected manually. Each pixel whose distance r is greater than 0.75 times the ideal log radius is chosen to be post-processed. This approach deletes misclassified small areas—which occur mostly near the outer edges of the log—as well as retains important information (like splits) near the center of the log.
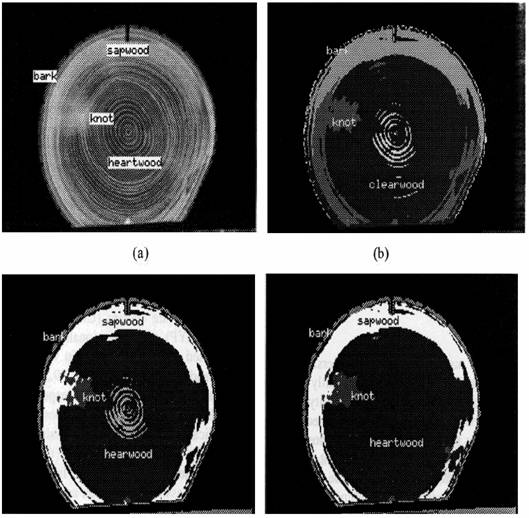
Fig. 5. A CT image (256 x 256) from a yellow-poplar log with knots, bark, sapwood, and heartwood labeled illustrates the density value difference between heartwood and sapwood (a). When this image (a) is labeled using a 3-D classifier with only four outputs (no separate sapwood class), sapwood regions are mislabeled as bark (b). A second 3-D classifier (including a sapwood class) applied to the same image (a) results in visually more accurate labeling (c), with the exception of annual rings mislabeled as splits. This latter classifier, trained with additional samples from the error-prone section of yellow-poplar logs, now correctly ignores annual rings and treats them as belonging to clear wood (d).
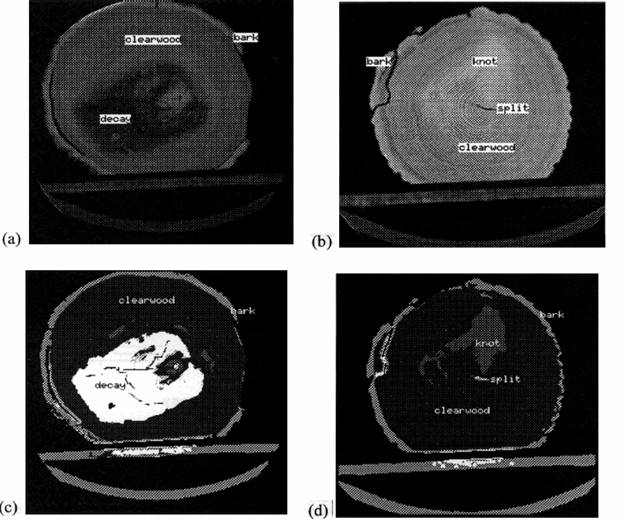
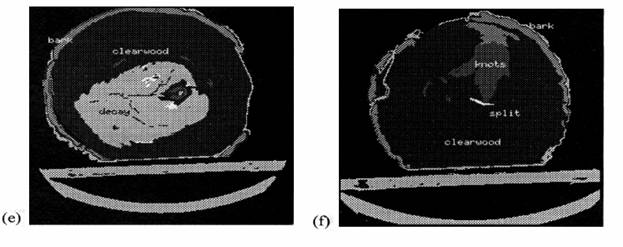
Fig.6 Two examples of CT images of red oak logs processed by 2-D and 3-D classifiers: (a) an original CT image; (b) a second CT image; (c) the result of image (a) labeled by the 2-D oak classifier; (d) the result of image (b) labeled by the same 2-D classifier; (e) the result of image (a) labeled by the 3-D oak classifier; (f) the result of image (b) labeled by the same 3-D classifier. (Images (e) and (f) were generated by Li (1996) and used a different postprocessing method.)
A similar system used for detection and rendering of internal log defects using computer tomography was realized by Bhandarkar, Faust and Tang scientist and it is called CATALOG (Computer axial thomography for analysis of log’s).
Using the obtained CT image slices the CATALOG system allows efficient 3D reconstruction and 3D visualization of the log sample. A detailed analysis of the sequence of cross-sectional CT images of the log sample results in the generation of a 3D model of the log sample that incorporates both (i) the 3D characterization of the internal defects and (ii) the 3D characterization of the ring structure of the log sample. The 3D model enables the user to view the log sample from any user-specified orientation and viewpoint and also view the interior of the log sample for any user-specified orientation of the cutting plane. This enables the viewer to evaluate a wide variety of sawing patterns without putting steel to wood. CATALOG can also simulate veneering operations on logs and on flat boards obtained by sawing the logs. The voxel-based 3D log model in CATALOG results in a very realistic rendering. Efficient algorithms for mapping the voxel data to pixel data in the sawing plane or veneering plane result in superior run-time performance.
A major difference between the approach followed in CATALOG and other similar systems is that CATALOG employs a two-stage approach: generation of a defect hypothesis using 2D information from single CT image slices and verification of the hypothesis using 3D information.
The CATALOG system consists of four principal subsystems:
1) Preprocessing and segmentation of individual 2D CT image slices.
2) Detection and classification of internal defects in the individual 2D CT image slices.
3) 3D reconstruction of the internal defects and the internal structure of the log.
4) Simulation of machining operations on the 3D reconstruction of the log.
Figure 7 depicts the overall structure of the CATALOG system. The CT images of the logs were captured using a Toshiba TCT 20AX CT scanner, which has a pixel resolution of 0.75 x 0.75 mm and a scanning pitch of 5 mm. Each CT image is 320 x 320 pixels in size with an intensity resolution of 8 bits per pixel (i.e., 256 gray levels). Thus, a log segment of length 1 m produces 200 images resulting in a total of 200 x 320 x 320 « 19.5 MB of raw image data.
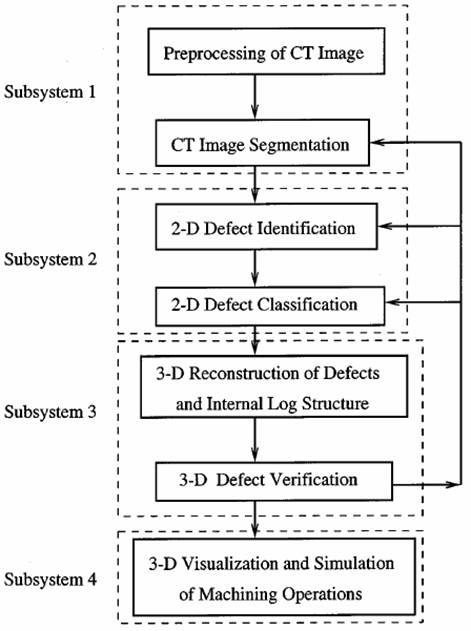
Fig. 7 The high-level structure of the CATALOG system
In the initial stages, the defect detection and classification procedure in CATALOG adopts a bottom-up processing approach. It first processes and analyzes each CT image individually and then correlates the results from each CT image with those from neighboring CT images to extract and classify the relevant 3D defects. The knowledge of the 3D internal defects and the growth ring structure deduced from the individual CT image slices is used to reconstruct a 3D model of the internal defects and the internal structure of the log. The reconstructed 3D model is used to detect and rectify errors in the segmentation and classification of the defects in the 2D CT image slices. This ability for top-down verification and error rectification is one of the salient features of CATALOG which sets it apart from other existing computer vision systems for log inspection and lumber grading.
CATALOG is capable not only of 3D reconstruction and visualization of the scanned logs but also of simulation and visualization of key machining operations on logs such as sawing and veneering. CATALOG uses a 3D volumetric log model derived by the stacking of the data and results derived from successive CT images. Consequently, the results of our simulation and visualization algorithms are more realistic. In spite of the large volume of data that needs to be handled, the simulation and rendering algorithms are efficient enough that the run times would be considered acceptable in a real-time lumber production environment.
For the sawing operation, the user can specify the positions and orientations of the sawing planes, the position and orientation of the log and the viewpoint of observation, each either in a world coordinate reference frame or in the log coordinate reference frame. Once the log is sawed, the user can view the cross section from any viewpoint. The cross section contains both, the markings from the growth ring structure as well as the log defects. Simulation of the sawing operation enables the user to view the 2D boards that would possibly result from subjecting the log to a certain sawing scheme. Figure 8 depicts the result of a simulated sawing operation on a 3D log reconstruction.
|
|
Fig. 8 The resulted board afther the simulated sawing operation
CATALOG is also capable of simulating the veneering operation on the 3D log reconstruction as well as on 2D boards that result from the sawing operation. Bouth the rotary-peeled veneering technique is used where the wood is shaved off the cylindrical surface of the log using a rotary lathe machine and also the wood is shaved off the board surface using a slicing machine.
A very good realized computer tomography image obtained by mens of the CATALOG system is presented in the figure 9.
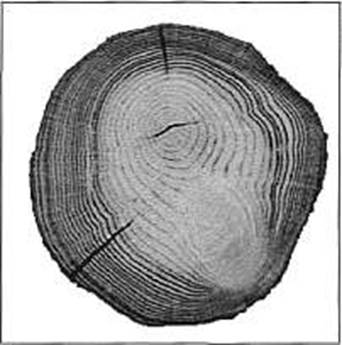
Fig. 9 A CT image of a Red Oak with an irregular rig structure
obtained using the CATALOG system
Conclusion:
As an overview regarding the x-ray computer tomography technology we can say that.this is a complex process which realized by means of different processing steps and techniques. The actuall scanning of one image slice of a log is practically identical with the scanning process realized in medicine. The scanning of logs instead differs from other scanning operations by the fact that the log is actually slieced in more CT image slices which are decoded and processed and the reconfigured in order to obtain the virtual 3D image of a log. Another difference consists also in the interpretation of the obtained image slices and virtual 3D image in order to obtain the desired informations.
In the figure 10 the scematic representation of a log scanning and the slicing process during the computer tomography process is presented.
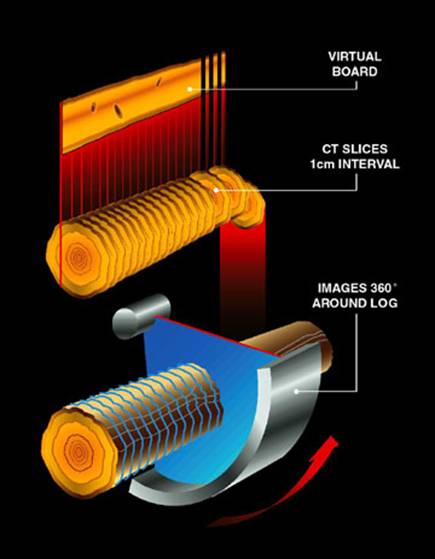
Fig.10 Scematic representation of a log scanning in order to obtain the desired CT image slices
The resulted 3D image of the log is practically the data from which we can start to configure an optimum cutting model for the scanned log.
In the figure 11 a 3D virtual image of a scanned log is shown.
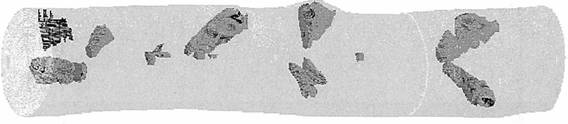
Fig. 11 Representation of a 3D virtual image of a log
By combining the obtained 3D virtual image of the log and by usage of the known sawing and veneering techniques an highly optimizes sawing process can be realized.
As a futher development of the tomography technology we can say that a „sawmill of the future” can be 100% automated and computer controlled. The sawing process could be done exclusive by means of computer numeric programs which elaborate based on the virtual 3D image of the log the optimum cutting model. More than that the obtained timber can be actually graded before the sawing process is processed and exact production yields can be pre-sawing calculated.
I.7 PARAMETERS OF EXISTING
SCANNING TECHNOLOGY
If we consider the computer scanning process we need to take into consideration more functioning parameter. These parameters would be: speed of scanning an information processing, frequency of scanning, resolution, characteristics of the the processing logs (maximum diameter, maximum length, moisture content).
Considering the productivity of the process and also the possibility of implementation on industrial scale we can say that the scanning and data processing speed represent the moust important aspect regarding computer tomography. Even if the process of scanning and data processing can be done with very good results we can say that until now the implementation of computer tomography process on industrial scale could not be realized because of the reduced data processing speeds.
The most serious technical difficulties are image acquisition time, image reconstruction time and automated analysis processing time. Since a rate of three logs per minute is not uncommon in many sawmills, little time is available for acquiring, reconstructing, and processing an extremely large amount of image data. The amount of information that must be processed is a major problem for both present human operators and for any future automatic system. Important development with regard to image acquisition has been the scanning electron beam CT scanner created by Imatron, Corporation. In its ultrafast mode, the Imatron CT scanner can acquire a pair of anatomically contiguous slices at the rate of thirty-four images per second. Compared with the rate of about one slice per second for the third and fourth generation CT scanners, this acquisition time speed improvement is substantial. It represents a basis upon which a commercially viable CT scanning technology can be built. Admittedly current image reconstruction times and current automated image analysis times are still much slower than would be required of commercially useful systems. But future developments in microprocessor technology should help alleviate these two problems as well.
In case of CATALOG system the algorithms for defect identification, defect localization, 3D model reconstruction, and simulation and visualization of machining operations were implemented in Visual C++ on a 200-MHz PentiumPro workstation with 256 MB of RAM.
The defect identification and localization process (with 3D analysis) averages in this case for the CATALOG system 112 s on a 1-m-length log which resulted in 200 CT image slices, each of size 320 x 320 pixels with a gray-level resolution of 8 bits per pixel thus amounting to approximately 19.5 MB of raw image data. The 3D model reconstruction algorithm averages 57 s whereas the rendering algorithm for the 3D log model averages 49 s. Overall, the entire process of defect identification, defect localization, 3D model reconstruction and rendering takes between 3 and 4 min for a log. The graphical simulation of the sawing operation averages 38 s for a cut defined by two sawing surfaces. The graphical simulation of the rotary-peeled veneering operation averages 8 s for a veneer of length 1.2 m and width of 1m.
Although the run times mentioned above are impressive, they fall short of those required for real-time processing of lumber in a sawmill. The use of faster hardware is an obvious solution and so is the use of parallel computing. It is to be noted that the processes for defect identification, defect localization and 3D model reconstruction could be pipelined. One could also exploit data parallelism at the pixel level for each of these processes as well as for simulation and visualization of machining operations.
In order to test the computer tomography process a prototype scanner was already tested in western part of USA and in Steiermarkt province in Austria at the sawmill belonging to the Sägewerk Schäffer company. The technology was produced by the InVison company in the USA.
Regarding the characteristics of the processing logs we need to mention that these should be as much as possible similar to the characteristics of the allready processed logs in some certain production units. More information regarding this aspect will be given later in connection with the characteristics of the TOMOLOG scanner and LOGEYE sistem produced by MICROTEC company.
I.8 AVANTAGES PROVIDED
BY THE WOOD SCANNING OPERATION
Growing demand for lumber products and limited forest resources are forcing the hardwood industry to seek more productive conversion of logs to lumber. Conventional log sawing practices waste a considerable amount of valuable wood, largely because defects that significantly lower board quality are at unknown locations inside the logs.
The conventional breakdown method of a log relies on visual examination. The sawyer first considers the exterior of a log and chooses an initial breakdown strategy. This is modified as sawing incrementally reveals the log's interior. This method has several drawbacks. Among the most noticeable is that exterior bark distortion provides only limited information concerning internal features. In addition, repeated manual operations are subject to fatigue and subjective variation.
Because the value of hardwood lumber is inversely proportional to the quantity and sizes of defects, log breakdown strategies generally seek to minimize defects in the resulting boards. Sawing logs under different log orientation and using different sawing methods greatly impact lumber value. Conventional types of sawing, however, are 'information limited' in the sense that the sawyer has knowledge only of external indicators of internal features . This greatly limits the sawyer's ability to achieve potential log value recovery. Developing nondestructive sensing and analysis methods that can accurately detect and characterize interior defects is critical to future efficiency improvements for sawmills.
If the decision is to saw the log into lumber, several studies have shown that the value of the lumber sawn from a log can be increased from seven up to twenty-one percent if optimum positioning is used during saw up. Optimum positioning depends on the location and identification of internal log defects. The basic goal in sawing hardwood lumber is to create boards with as much clear face as possible. While no formal studies have been conducted, positioning also would seem to play an important role in determining the value of veneer that can reproduced from a veneer log. Once again the best positioning is the one that gives veneer with as much clear face as possible.
Beacause
of the good yield increase possibilities given by log positioning in the
hardwood porcessing the logs are sawn by means of selecting sawing using band
saw machines. For a good processing extremly skilled personnel is required in
order to be able to realize a good cutting yield. Even the best qualified
personnel can not proces optimum and can not take 100% exact decisions. From
this reason surface examination scanner where projected in order to obtain the
best results. These devices inspect the log surface, and aspects like crook, bow, ovality, taper and log-diameter.
Also surface defects like visible knots, cracks and other are considered. In
this way a optimum orientation for sawing is established. In the next figure
(fig. 12) a surface
scanner log-optimizer ProScan from Pronyx Wood is presented.
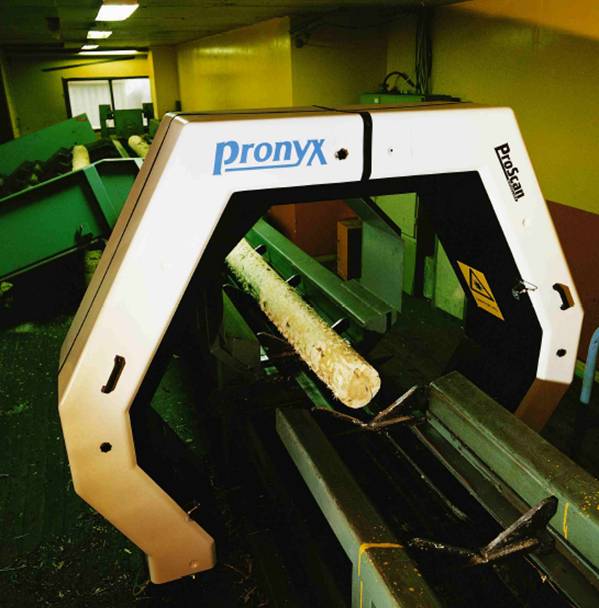
Fig.12 Surface scanner log-optimizer ProScan from Pronyx Wood
Regarding the selective sawing of logs into timber by means of surface examination we can say that a maximum level of technologization was achieved. In these field no hypothesis for futhure development where establised. A tacit assumption for eventual application of internal scanning to log sawing is that knowledge of internal defects will lead to greater sawyer productivity.
Multiple studies come to confirm this hypothesis. We can identify several operational scenarios: provide a 3-D image of the log as sawing occurs ('glass log') so that the sawyer can choose a best opening face using more complete (internal) log information, couple computer rendering of the log and its orientation on the carriage to accurately control log positioning by manipulating the computer rendition, have the computer suggest a best opening face to the sawyer and automatically position the log for that cut, or have the computer suggest the next face to cut during grade sawing by tying log face rendering to computerized lumber grading software. Log breakdown assisted by 3-D rendering is 'fully informed,' where the sawyer has knowledge about internal feature size, type, and location.
Several studies where done in order to be able to calculate the gains that can be achieved by usage computed tomography regarding higher production yields and better final product qualities. Such a study was developed by Schmoldt et al. in 2000 at a softwood sawmill in Austria on pine and european larch logs. The image of the scanner tested in 2000 in Austria is presented in fig. 13
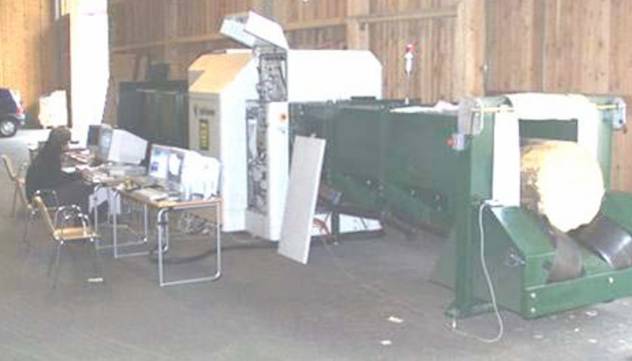
Fig. 13 First test of CT scanner usage in Austria 2000
Two sets of logs (over 100 logs total in this study) with comparable diameters were randomly placed into a scan group and a control group. For the scan group, logs were CT scanned and reconstructed images were presented to the sawyers. Using a tool developed by In Vision Technologies, sawyers were able to see simulated board faces (virtual cuts) for different cutting positions. Selection of the cutting positions for log breakdown was done as usual, except that the sawyer could view deeper cuts without the risk of making expensive mistakes. For this application, a thicker board has a higher value compared to several thinner boards. But, without CT assistance there is significant risk in cutting too deep into the log to capture a thicker board. The quality of the hidden face of a thick board may be worse then expected. In such a case, one or more high quality thin boards would have been a better choice. No additional computer-based optimizations were performed. Sawing patterns were then manually marked on the log ends to serve as a guide for the physical sawing of the logs at the headrig.
The control group was processed according to the normal operation of the mill. After the primary breakdown, all boards from both groups were blind-graded by expert grad ers (without knowing to which group boards belonged). Using volumes and prices, the value yield for each log was calculated. As one example out of the study, the results of grading 30 high quality spruce logs with diameters of 51 cm and larger showed an increase in value per m3 of 6.3% for the scanned group (8.8% if the best and worst logs in each group were removed).
Normally, most of the high quality boards in that mill are cut as intermediate products for the window frame industry. They are processed further to produce slats in a secondary breakdown. If the classification of the primary board was correct, a high percentage of the board can be used for slats. So this secondary stage of processing is an excellent indicator of classification accuracy for the CT system compared to experienced sawyers, and might be a better demonstration of yield improvements by the CT system.
Slats where produced from boards with a thickness of 153 mm. With this dimension, it is very difficult to correctly estimate the quality of the board on the back face. After grading the slats, the control-group slats yielded 31% (in value) for grade A (the highest value grade), 49% for grade B, and 20% in grades C and D (the lowest value grades). On the other band, the CT optimized boards resulted in 71% grade A and only 1% in grades C and D (Figure 14 and Figure 15). This improvement cannot normally be achieved without knowing the quality of the board in advance.
Fig.14 Qualities of slats obtained by conventional sawing
Fig. 15 Qualities of slats obtained by optimized sawing by means of computed tomography
The study of Hodges et. al developed already in the 1990 showed a increase in quality for the produced timber of about 15-18 %. This studies was done for the technical and scienetific posibilities that wher known at that time but since than the subject of internal log scanning was highly debated and reserach has also given us new data about it. The study provided also interesting informations about the final cost of a futher produced log scanner based on the cost of that time in mediceine used CT scanners.
Also the study of Mueller and Teischinger from 2001 indicates an increase for the production yield of about 10-11% in case of implementation of computed tomography on industrial scale.
When we speak about advantages provided by computed tomography scanning implementation we need to consider also other aspects. We need to say that advantages provided by surface log scanners are also possible to be achieved very easy by internal log scanners. The exact measurement of the quantity of logs that are processed can be realized without problems. The inspectation of logs regarding crook, bow, ovality and taper will be also very easily realized. We need to mention that the cost of optimization technology which is based on surface inspectation is also at a high level. It may be that some companies will not obtain so hig increase of incomes by the investment in this technology but because of the better production yields provided by the usage of a CT scanner to in the position to b fit for such an investment. Regarding the stay of facts on romanian market where I do not have the knowledge about the utilization of a surface inspection scanner for timber production, it can be that many hardwood timber producers will desire to invest in such a technology.
The internal scanning of logs can provide us with advantages not only if we like to saw a log into timber but also before this decision is done. First one must decide whether a log is a saw log or a veneer log. Since a veneer log is worth approximately ten times as much as a saw log, it is very important that this decision be made as accurately as possible. Whether a log is a saw log or a veneer log depends on the number and distribution of its internal defects.
Because of the big difference between the price of a veneer log and the price of a log that is destinated to by sawn into timber, a timber production company will have hypoteticly the posibility even to resell the logs that where purchased at a low price and that have the technical characteristics of a veneer log. It may be that a internal scanning of a log reveals a structure that make that log fit to be processed into veneer. In this way it may be that the timber producer will gain more incomes from reselling the log to a veneer producer than from sawing it into timber. This aspect can be only tested on particular markets where fixed prices for logs and timber are known.
Another advantage is that by usage of CT internal log scanning a software may be ableto provide us with the exact mechanical characteristics of the futhure produced timber pieces. In this way the timber will need to be sorted only considering the quality of the surface produced by the cutting process, therefore the sorting process is simplified and so the costs of it will be decreased.
Not only the timber grading process can be optimized by CT usage but also the process of metal detection process that is compulsory to be done before sawing is preocessed. By computer tomography not ony that metal inclusions can be detected but also one can detect the presence of any type of material within the structure of wood. We can mention here the presence of stones, plastics or other types of materials. In the figure 16 a computed tomography image consisting of a log having a metalic inclusion in it’s structure is presented.
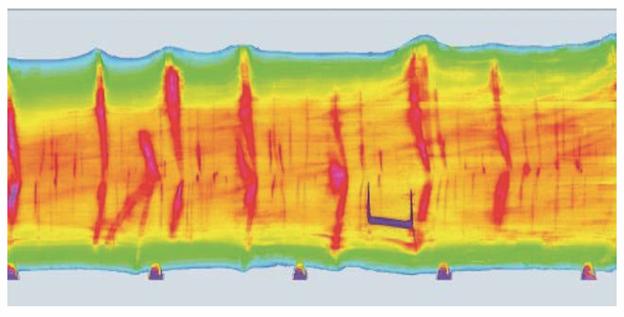
Fig. 16 CT image revealing a log metalic inclusion
Considering the advantages mentioned previous we can say that many developing possibilites can be identify. As sai before a „sawmill of the future” can be realized where the cutting process can be 100% autmatic where the positioning of the log and the cutting model can be established based on the 3D virtual image of the debarked and scanned logs. Furthermore the grading of the produced timber pieces can be determined outgoing from the informations received afther the log scanning is done.
The scanning of logs can be also realized not only at the timber production unit but also at a log yard.
Log brokering operations (concentration yards) provide a convenient intermediary between loggers/land owners and sawmills/log buyers. In particular, these yards form an important link between the small- to medium-sized landowners and similar sawmills. Harvested logs are brought to these concentration yards either by independent loggers or by broker-contracted crews. In most instances, logs are bucked, i.e., log lengths of 2.5-5 m are produced from tree-length stems on the log deck at the harvest site. This greatly simplifies transport, but leaves an important processing decision to variably trained-and incorrectly rewarded-log-ging operators. Most of these bucking operators have a volume, but no value, incentive for their bucking efforts (Pickens 1996). From concentration yards, logs are then merchandised to various client sawmills based on a bill of materials (Bush et al. 1992). Prior to sale, the merchandiser grades each log (based on external characteristics) and estimates board-foot volume. Logs are then sold in batches to appropriate mills based on species and anticipated product. The highest quality logs go to veneer mills, or are exported. Lower quality logs go to various sawmills for lumber production.
Locating a log scanner at a concentration yard possesses several theoretical advantages. First, it allows many members of the hardwood industry to take advantage of advanced technology. Second, it generates important log information early in the processing stream, so that it can be used throughout mill operations. Third, it greatly increases the objectivity of log valuation; less guesswork is involved in log pricing. Precise pricing can be reflected in prices paid to landowners, can provide incentives for loggers to buck for log value (not volume), and can ensure mills that they are getting the log quality that their operations need. The information generated adds value to each log-value that is retained in the local economy. While the price of the log might increase by the cost of the scanning operation, it will be more than offset by the benefits mentioned above accruing from the information (Hodges et al. 1990).
With a concentration yard log scanner, logs can be scanned, automatically graded, and optimized for sawmill breakdown. Current hardwood log grading rules estimate clear wood volume by examining external characters of the log faces. Detailed internal information should provide better estimates of log grade and even permit development of an alternative set of log grades based on internal information. Because scan information will allow simulated breakdown of the log into lumber (which can be computer graded), it should also be possible to generate a lumber grade distribution and lumber value for each log. When a sawmill takes delivery of a log, it could have an accurate log grade, a description of the lumber contained in the log, and information about the internal structure of the log. Sawmills can purchase whatever level of detailed information they wish to use, and feasibly could do so on an individual log basis. The nature of the internal information can be manifested in one of two ways:
- saw line markings on the log ends can indicate the location of the best opening face, or the location of maximal clear wood content
- a computer file can contain reconstructed 3D images, and/or log breakdown optimization data with lumber yield
Another immediate advantage of such a system for the small mill is that with little or no infrastructure changes, they can buy and utilize logs that have been CT-scanned upstream at the concentration yard. If a sawmill chooses to use the grade and the location of the best opening face or clear wood (as marked on the log ends), then there will be no setup cost. On the other hand, if a sawmill would like to customize certain logs-e.g., the intermediate grade logs which value varies greatly depending on breakdown pattern-by also procuring the prescribed log breakdown optimization, then it will require a small setup investment in a PC-based computer system, a barcode reader, and a visualization/imaging system. The latter investment will be required to register the log with the stored scan data and download the breakdown optimization. Furthermore, it should be possible in the future to tailor optimization patterns to individual mill operations and product lines.
1.9 PRESENTATION OF THE TOMOLOG CT SCANNER
AND OF THE LOGEYE SYSTEM
PROJECTED BY MICROTEC GMBH ITALY
MiCROTEC GmbH is the technology leader in the field of opto-electronics for the timber processing industry and has been setting the standards in this market since 1980. The company’s exclusive focus and specialisation on timber and its processing have brought itself in top position on the market. MiCROTEC originates from and still has its head office in Brixen in South Tyrol, Italy, a region where timber processing has a long tradition. Over the years MiCROTEC has set several technological milestones and has undergone steady growth. With a workforce of over 120, the MiCROTEC Group has a global turnover of over 25 million Euros.
MiCROTEC knows wood, the living raw material and its varieties, but also the technological possibilities for resolving problems connected with automated processing. MiCROTEC’s innovative solutions increase the performances in wood processing in terms of quantity and quality and are the expression of this skill. Therefore, in complex projects MiCROTEC is always the only contact for its customers.
Microtec company has designed a system that realizes the operation o log scanning and 2 an 3D imaging of the log. The name given to this device is TOMOLOG. TOMOLOG by MiCROTEC recognizes the quality of logs. Its unmatched measurement results are essential for realistic value estimates and subsequent production planning. It produces a realistic, transparent 3D model of the log without the need to contact the material. It records bark separately and subtracts it from the calculation of the net cubic volume. In addition, TOMOLOG also determines the 3D position and size of knots, foreign metals and contaminants, weak areas, and even the width of the annual rings. In figure 17 the virtual representation of the TOMOLOG system is presented whereas in figure 18 a photograph image of the outside view of the TOMOLOG scanner is provided.
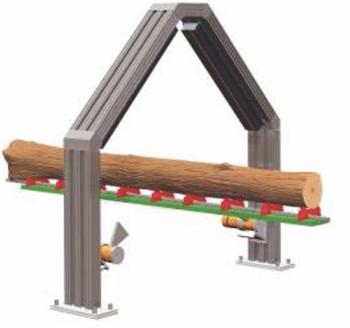
Fig. 17 The virtual image of the TOMOLOG system
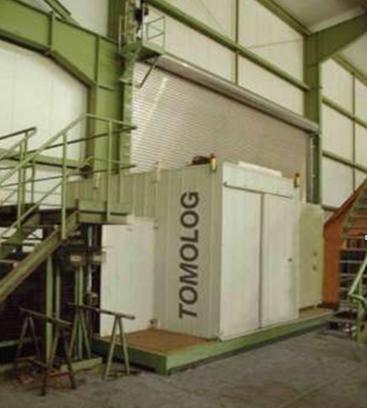
Fig. 18 TOMOLOG by Microtec
With the help of two X-ray sources and sensors TOMOLOG measures the raw density of the wood at a longitudinal conveyor speed of 200 meters per minute. Despite the high conveyor speed, it identifies areas with different densities such as knots, weak areas or foreign objects and measures them exactly. The result is a transparent model of the log, which also includes an image of the exact position and dimension of knots, foreign objects and defects. In the Figure 19 a image slice obtained by scanning of a log using TOMOLOG system is presented.
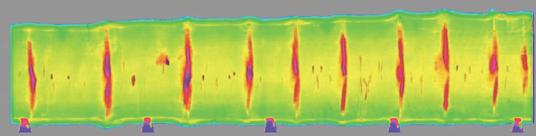
Fig. 19 Image slice obtained with TOMOLOG by Microtec
The measurement data are processed by the optimizing computer to produce an exact model of the log. The user can visually check the image on the screen with the quality influencing factors emphasized.
The TOMOLOG measurements remain available for further evaluations and can be transferred to subsequent systems e.q. to automatically control the sawing or sorting process. The system is controlled by a user friendly interface. The results, data and statistics are shown in text form or are easy o read tables or graphics. In figure 20 the interface of the software used by the TOMOLOG system is shown.
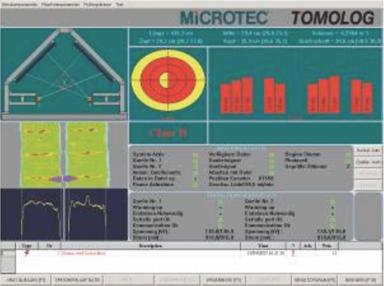
Fig. 20 The interface of the software used by TOMOLOG by Microtec
TOMOLOG’s TÜV tested X-ray source is covered by a lead-coat-ed casing and works using an average radiation excitation voltage of 200 kilovolts. If someone enters the measurement area, the X-ray source is immediately shut off by interlock switches.
As a summary we can say that TOMOLOG device is capable to realize the following operations:
1. Recognizes the quality of logs before
processing
2. Produces a realistic, transparent 3D model of the log
3. Considers the bark separately to calculate the net volume
4. Essential for value estimates and production planning
5. Shows the shape and position of knots, foreign objects and defects
6. High precision at high longitudinal conveyor speeds
7. Controls subsequent sawing and sorting processes
Regarding the technical details concerning the TOMOLOG system we can say that these manage to fit the requirements desired for a industrial application. The technical data is presented in the following table, table 1:
|
Charateristics |
|
|
Basis |
1-3 X-ray sources and 1-3 X-ray line sensors |
|
Direction of measurement |
Longitudinal feeding 200 m/min |
|
Length resolution |
Up to 4 mm |
|
Cross resolution |
Up to 0.8 mm |
|
View field |
0.5 m log diameter |
|
Operating temperature |
For use in rooms with controlled temperature (+5 to +35 Celsius dergree |
|
Power supply |
4800 W, 230 VAC |
|
Housing |
Lead coating |
|
x-Ray source |
200 Kilovolt TÜV certificated |
|
Frequency |
1500 slices / second |
Table 1 Techincal data sheet for TOMOLOG by Microtec
The TOMOLOG device is just one step in achieving achieving all the advantages that can be obtained by usage of CT in timber production. This device needs to be integreted in a system that also calculates the best cutting model, establishes the mechanical characteristics of the produced timber and calculates the exact dimensions, ovality, curvature and exact characteristics of a log. A system that realizes all these operations and which includes the TOMOLOG scanner was also projected by Microtec, and it is called LogEye.
LogEye is the Multisensor approach for log scanning combining the X-ray Multi view with 3d Scanning, Color Scanning and Vibration Analysis. A virtual image of the LogEye technology is presented in figure 21.
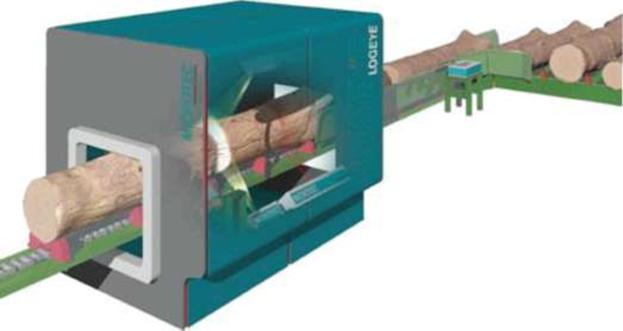
Fig. 21 Virtual image of the LogEye system
By usage of LogEye system any defect on the inside or on the surface of the log is recognized and localized. First LogEye establishes the exact contour of the log with all the convexities, curvatures and ovalities and realizes a clear digital image of it. Using X-rays the system can „see” inside of the logs and can measure the positioning of knots, cracks and barck. The Viscan-module of the system capture the proper frequency and the density. Depending on the destination of the log a optimum cutting model will be determined and saved. The logs will be graded based on their qualities and a further utilization of them will be decided.
The results provided by the LogEye system are very helpfull for a precise production planning based on a realistic and optimum price basis.
The LogEye Multisensor-system is the combination of more Microtec modules all of these modules can function also as singular systems. These modules are called TOMOLOG, DiSHAPE, SCREENLOG, ViSCAN and MAXiCUT. The TOMOLOG module was already presented.
The combination of laser triangulation and the DiSCAN 100 differential reflected light scanning, DiSHAPE forms realistic 3D image representations of logs and lumber without any shadows from chain bars or other obstructions. It not only registers all depressions, but also sweep and ovality of the log. Furthermore the exact position of the ovality is precisely recorded.
DiSHAPE measures the exact shape and circumference of logs as well as cants and prisms. The in-built DiSCAN100 module scans the log up to 2,000 times per second. The result is an exact 3D image of the profile with all irregularities. Shadow zones from chains, belts and drivers are entirely removed.
The accuracy of the 3D reconstruction – less than one millimeter discrepancy – ensures that DiSHAPE finds the smallest and biggest diameter of the log. This allows optimization at the merchandizing deck, log rotation and bucking.
DiSHAPE can also be configured for different metric standards as it accurately records depressions, curves, ovality and their respective position. Therefore, it is possible to the financial value of products and their volumetric quantity. Although others offer some software for this purpose, MiCROTEC provides a wide array of superior optimization programs and assists in custom programming for its clients.
Another value-adding feature of DiSHAPE is the opportunity to use the conveyor belt at high speeds. It is possible to reach a speed of in excess of 300 meters per minute without jeopardizing accuracy. In fact, the system is intelligently designed and scaleable such that it will never be outpaced by machinery.
The data obtained with DiSHAPE’s measurements are stored in the main computer system and recalled by subsequent MiCROTEC evaluation and optimization programs, such as WiNLOG for processing logs, or iNTEROPT for bucking systems. The data are used for automatic computations according to custom specifications or individual needs. It also controls the sorter operation in mills.
SCREENLOG consist of a standardized measurement hardware and its dedicated smart software. The high resolution image recording system DiCAM by MiCROTEC, combined with a light source, is incorporated in the measurement module. Four measurement modules are arranged laterally and inclined.
The log is transported on the longitudinal belt with a speed up to 240 m/min and is continuously photographed by the SCREENLOG’s image recording system. The inclined arrangement of the modules permits the detailed recording of both front faces without shadows from the transport cross bars or other obliterations. The resolution is 0.25 mm. No other industry system can meet these standards.
Upstream from the SCREENLOG is the three dimensional measurement system DiSHAPE which records the length, diameter, sweep and ovality of the log in a precise form and displays a 3D model. SCREENLOG’s smart software projects the continuously photographed log surface onto this three dimensional image.
In this way a photorealistic, three dimensional image of the log is obtained which can be viewed and examined from all sides including its details and faults.
Each individual image is automatically registered in compressed form and is therefore available at all times. To the digitized log all other data derived from manual input or a DiSHAPE measurement is also associated.
ViSCAN is the new optical vibration measurement by MiCROTEC for determining a board’s stiffness. The board’s stiffness is measured when transported sideways with unsurpassed precision.
ViSCAN measures the vibrations directly on the board with a laser and then works independently from environmental conditions e.g. noise, which could affect the measurement results. This means ViSCAN reaches a repeatability and measurement precision of over 99 percent.
The boards pass through the ViSCAN sideways at a speed of up to 150 pieces per minute. As they pass through they are vibrated. The laser interferometer measures the natural frequency directly on the board but does not touch it. This means the accuracy of the measurement achieves a maximum discrepancy of less than one percent. Truly a world record.
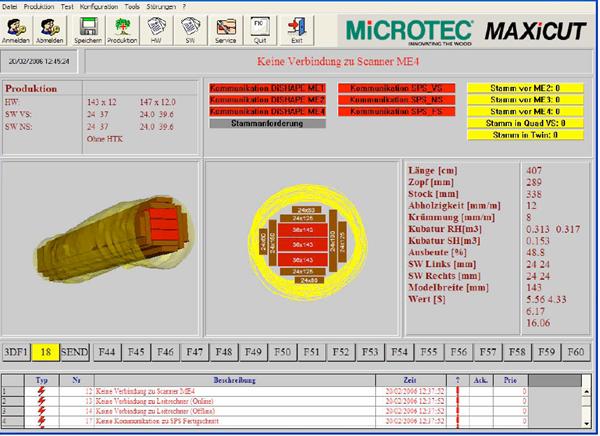
Figure 22 Interface of MAXiCUT by Microtec
Calculation of the optimum cutting model for round wood
Using the vibration data and board length ViSCAN calculates the dynamic modulus of elasticity (MOE) value and then the board’s stiffness. ViSCAN also measures the density and therefore improves the predicted resistance.
The results are so exact that to date ViSCAN has already fulfilled the new European prEN 14081 standard. MiCROTEC has already requested recognition for meeting this standard.
Thanks to the precision of the measurement, with ViSCAN it is possible to automatically sort the boards into resistance classes. By doing this MiCROTEC already provides support for its customers in its commitment to fulfill the product guarantee conditions.
Maybe one of the most important module in the system is the MAXiCUT module. This module calculates considering the data received from the other modules the optimum cutting model for each log. In figure 22 and 23 the interface of MAXiCUT module operating some suggestive processing is revealed.
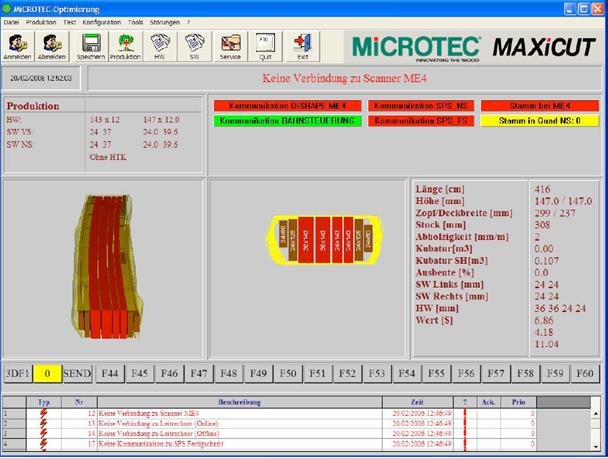
Fig. 23 Interface of MAXiCUT by Microtec
Calculation of the optimum cutting model for sawn wood
During 2007 MiCROTEC set a new benchmark in the sector of research and development for recognition of quality on round timber. At the Hannover fair the new multisensor system LOGEYE was presented. Still Logeye has some limitations in the fact that it can be used only for logs having a maximum diameter of 500 mm.
MiCROTEC developed a new product, it is a CT scanner. The prototype of the research project has been installed in Freiburg (D). This scanner has been developed together with the FVA (Forstliche Versuchs- und Forschungsanstalt) in Freiburg and helps the further development of LOGEYE. With this scanner MiCROTEC sets new benchmarks in round timber scanning. The prototype began the operation in december 2007. With this new system the electronically company opens unknown possibilities in nondestructive recognition and measuring of internal wood structures.
An absolutely revolutionary and fascinating project has been developed with the FVA (Forstliche Versuchs- und Forschungsanstalt) of Freiburg. The CT.LOG is the first system of its kind in the world.
This system is able to x-ray also big diameters and gives to the raw material wood a new dimension.
Function of this tomograph is the detection of volumetric density information of round timber. The measured data are converted into tomography pictures. The starting point is the measurement of attenuation of x-ray. With the information about the measured intensity of x-ray it is possible to reconstruct internal characteristics of the object.
The precise x-ray examination of the whole log allows a detailed description of the wood which can be sold or handled according to its characteristics. In the next figure, fig.24 the image of the new CT.LOG is presented.
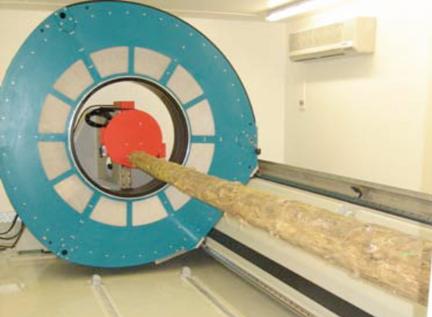
Fig 24 CT.LOG by Microtec

CAP.II
PRESENTATION OF
A TECHNOLOGICAL FLOW SHEET
WHICH INCLUDES THE OPERATION OF
WOOD INTERNAL SCANNING WITH X-RAY
II.1 PRESENTATION OF THE CONVENTIONAL BEECH TIMBER PRODUCTION AND TECHNOLOGY
The industry of timber comprises the assembly of production units (factory’s) in which logs of different species are subjected to a mechanical cutting process, by sawing in logitudinal direction, having as a final purpose the obtaining of different processed pieces of different types.
Having different organizational methods, the production activity in a timber factory is developed in different departments (Fig. 25), as following:
log yard
sawmill house
thermal and chemical treatment department
timber yard
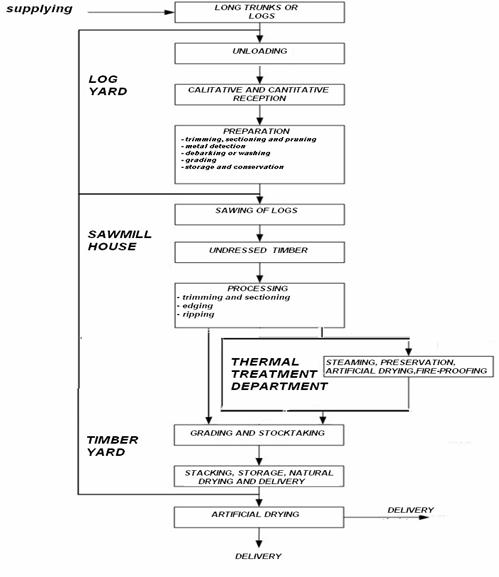
Fig. 25 Block scheme of a timber factory
II.1.1 Log yard
The log yard is the section where the preparation of the raw material for timber production is developed. Some of the operations are differentiated depending on the basic machine-assembly used for sawing.
In the flow sheet order the next operations are executed:
unloading of the long tree trunks or of the already preapeared saw logs
calitative and cantitative reception
trimming, sectioning and pruning of the trunks
detection and removal of eventually metalic inclusions
logs debarking
technological grading, marking and storage of logs (executed only in case of frame saw usage - not our case)
storage and conservation of logs
washing of the logs (in case of skipping of the debarking operation)
feeding of the logs to the sawmill house
The equipment and instalations used in the log yard are choosen concerning the executed operations, mechanization level and organization procedure of the log yard.
From technological point of view the suppling of the processing unit with wooden material and the qualitative and quantitative reception do not influence the sawing process and parameters.
Trimming, sectioning and pruning of the trunks:
The log yards receive the wooden material in form of saw logs (having lengths of maximum 6 m) or in from of long trunks.
The trimming and sectioning of trunks is the starting point in superior and integral capitalization (quantitative and economically) and must be done with special care.
The round wood received from suppliers having the dimensions and diameter required for the timber processing unit (saw logs) does not need to be subjecte to trimming and sectioning. Eventualy the saw logs can be subjected to pruning in case that these is needed.
The trimming of trunks is actually the operation of cross-cutting of the logs with the purpose of ends removal.
The sectioning is the operation of transversal cutting of trunks and logs having big length dimensions with the purpose of obtaining of two or more saw logs or also for removing of some possible defects. In case of beech wood round wood trimming and sectioning special care will be given for rot and overmaturing which are very frequent in the warm and dry season and which are not admitted for timber production.
Metalic inclusions detection
Some logs contain inside of them small metallic pieces, which can not be osbserved by the free eye.
The detection and removal of these inclusions before logs sawing into timber is indicated in order to avoid the damage done to the cutting tools, the appearance of accidental stops (idle hours) and the injury of the personnel.
The toothed blades that reach these metalic inclusions are subjected to important damages (tools consumption increases) determining the appearance interrupt handlings which can reach to 2-5% of the duration of a working shift.
In order to avoid these accidents different detectors of metalic inclusions where designed and executed and modern timber factories are equipped with such devices.
Debarking
Today many factories subject the logs to the debarking operation. By removing the bark also sand, gravel and other adulterants which are collected during manipulation of logs are removed from their outher surface
The debarking is required also to preclude the possibility of insects infestation of the logs during storaging.
The debarking operations provides also some other advantages like:
increase of the sawing and processing capacity of equipments by the increase of the usage period for the cutting tools between two sharpenings
decrease of the cutting tools consumption
new possibilities of utilization for the wood waste produced during sawing
elimination of necesity of debarking for the unedged timber
higher sawing precision and a smoother surface cutting
higher feed speeds
mechanical work for sawing is smalles thus smaller energy consumptions are obbtained
In case of sawing of logs with bark a intensive wear of the blades appears. The specific mechanical work for cutting, at the end of one working shift is in average with 22% samller for the blades that have processed debarked logs.
Grading
The technological grading of logs is very important for obtaing by sawing of high quantitative and calitative yields. In case of sawing with band saws the grading of logs needs to be done only regarding the wood specie of logs and eventually regarding the quality of logs but not considering the diameter.
Actually the technological grading is done toghether with the sectioning operation in case of trunks and on the unloading ramp in case of logs.
In case of beech logs, the grading concerning the length of logs is not necesarry because these are keeped all toghether. A qualitative grading is done sometimes for logs having a diameter of 36-55 cm. In these case in order to obtain a higher quantity of edged timber logs can be sawn into prims.
Conservation of logs
The logs destinated to be sawn into timber are exposed to a continously process of degrading and declassing if keeped for a long time in the log yard.
The prevention of these processes is realized by different processes of conservation, applied to the wooden material in function of specie, quantity, the period of storage, destination and processing type.
Beech logs immediatly afther felling are exposed to diverse processes of degradation, the highest danger is represented by suffocation (dote) as a result of the infestation of the wood with fungal spores which at a temperature ranging between 10 and 40 Celsius degrees penetrate in wood vessels, afther these are empty of wather. Thus in order to conserve the beech logs on will try by different procedures to maintain a high moisture content of the logs (having the vessels full with wather the spores will not penetrate them) or to keep the temperature of the wood outside of the dangerous limit (10-40° C).
Without special measures the second condition is fulfiled during the cold season.
The factories that during the warm season (mai-october) dispose of a large quantity of logs that can not be processed in 10-15 days, will need to consider some preservation procedures against suffocation, cracking and other degradations.
The main processes of conservation applied to logs are based on the maintaining the moisture content of the logs at a high moisture content (over 70%), by means of different methods like: dipping into wather, splashing with wather, application of different pastes or pellicels on the log ends etc.
Washing of logs
The washing of logs before sawing is a operation necessary and even compulsory if no debarking is done.
By washing the logs the mud, sand and other impurities from the log outher surface are removed and some improvements similar with the ones achieved by debarcking are obtained. Still we need to mention that if debarcking can be realized it will be more efficient to subject logs to this operation prior washing.
The washing of logs can be done either by dipping into wather tanks or by means of jets of wather under pressure.
II.1.2 Sawmill house
The process of transformation of logs into timber is developed into the sawmill house and includes two main groups of operations:
the sawing, respectively the longitudinal cutting of logs, by which the thickness of the timber pieces is obtained and in case of cutting of prism also the width is obtained.
the processing, respectively the trimming-sectioning, edging and ripping of the materials obtained by sawing, in order to remove big defects and to obtain the desired dimensions (length and width)
The sawing is processed using frame saws, band saws and special circular saws (considered basic machinery). The processing is realized using cross-cutt circular saws, circular ripping saws, circular edging saws and ripping band saws.
Band saws execute the of the log by passing it trought a band saw blade driven into a translation movement by to sustaining flywheel. These machines execute an individual sawing of timber pieces by succesive cuttings (piece by piece) and in our country are mainly used for hardwoods processing.
Band saws can drive also 2 or more band saw blades by the same functioning process. Also for timber production assembly’s of 2 or more band saws can pe designed.
Cross-cutt circular saws execute transversal sawing of timber pieces in order to remove some big defects from their surfaces and to trimm the ends. Considering the number of saw blades these machines can be simple, double or mutiple.
Circular edging saws process the edges of the timber pieces obtained from logs sawing in order to remove some defects and to obtain the final width of the timber.
The circular saw can be provided with one or more saw blades.
Circular ripping saws can work using one or more circular saw blades and have the role of sawing (ripping) of timber pieces having larger width dimension in timber pieces with smaller witdh dimensions destinate for different utilisations or in order to remove some timber defects.
Ripping band saws realize the obtaining of timber pieces with smaller thickness dimension from timber pieces that contain a multiple of such thicknesses or the obtaining of timber pieces from the wood slabs resulted afher sawing.
Generally the timber factories produce timber pieces having standard dimension and only on request pieces having different dimensions. The flow sheet from the sawmill house includes the following operations:
fedding with logs
qualitative and quatitative reception of logs at the entry into the sawmill house
sawing of the logs into undressed timber
drawing of timber (only for hardwoods)
processing the timber on cross-cut, edging and ripping circular saws.
ripping of timber on ripping band saws (only for softwoods)
collecting and transportation of timber pieces to the grading area
collecting and processing of the secundar products resulted from the sawing process.
The utilisation of band saws for timber production provide us with some advantages regarding the usage of frame saws like:
reduction of the labor required for grading of logs
reduction of space needs for the log yard by storage of all logs toghether.
possiblities of complex mechanisation of the operations.
reduction of the losses done by transforming of wood into saw dust. In case of band saws the losses are smaller with 20% than in case of frame saws.
a more rational utilisation of the sawn wooden material, the thickness of the timber pieces can be choosen regarding wood quality and existing orders
From the disadvantages of sawing of wood by means of band saws we need to mention:
a smaller productivity of timber production because of the existing of the passive return stroke.
a more difficult maintenance of cutting tools, the band saw blades
a more carefull prepration of the logs in the log yard, the band saw blades injury occure very easy
a higher percentage of rejected timber (brack) than in case of frame saws
The technical characteristics of a band saws stronlgy determin the maximun diameter of the logs that can be processed and also their sawing capacity. One of the moust important technical characteristic and maybe the moust important one is diameter of the flywheels.
Beside the technical dimensions band saws are also choosen regarding some working characteristics and the moust important are:
the rotation speed of the flywheels (revolutions per minute r.p.m) determines the cutting speed
cutting speed of the band saw blade is calculated with the relationship:
(1) v = ![]() where - Dv
diameter of the flywheels
where - Dv
diameter of the flywheels
- nrotation speed of the flywheels
- cutting speed of the badn saw blade
feed speed of the log carriage
actioning power – the power of the electric motor
Today the performances of the band saw machines and also for other basic machines used for timber production are improved continously. If in 1990 we could speack of feeding speeds for band saw machines of about 120-130 m/min today’s band saw machines can operate at a feed speed of even 200 m/min depending on logs wood species, diameter, structure etc.
The cutting speed can reach more than 42 m/s and the cutting height can reach also 2000 mm. Such a band saw is the vertical log band saw named „Rapid 2000 for tropical wood” produced by Pezzolato Officine Costruzioni Meccaniche S.p.a. Italy carring the Bongioanni brand. It is provided with an main electrical motor with a pwer of 110-160 KW. Such a machine is presented in figure. 26.
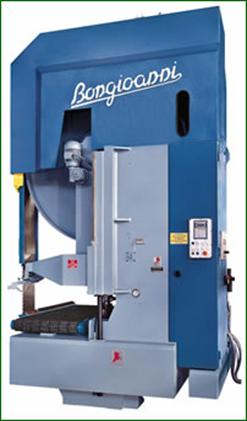
Fig. 26 RAPID 2000 for tropical wood vertical band saw
produced by Pezzolato Officine Costruzioni Meccaniche S.p.a. Italy
As said before the high number of hidden defects which occure at the hardwood logs, especially beech logs, determined the choosing of individual sawing as sawing procedure for these wood species.
All the time, the fundamental principle of the sawing of wood using band saws, is constiuted in carefully separation of the high quality zones of the logs from the zones having a lower quality. This is followed by the processing of the wooden material from each zone in timber pieces having the standard or requested dimensions. Following aspects are considered:
the limitation of wooden defects occurance (as few timber pieces as possible should include wood defects)
the obtaining of an optimum qualitative and quantitative yield.
The sawing methods used in case of the badn saw sawing of logs are choosen considering the diameter and quality of the logs and corespond to the processing machines contained in the following technological flow. It needs to be tried to realize a good cooperation between these processing machines in order to reach the maximum capacity of sawing and processing. The operator that runs the band saw will consider the maintaining of a ritmic loading of all the following machines without creating high loadings or empty spaces on their the working tables. Also the band saw operator will know the structure of the existing orders, regarding the thicknesses, lengths, qualities and processing grade in order to decide which products will be mainly cutted by means of the general cutting diagrams.
Even if the sawing of the logs on the band saw can not be realized considering a fixed cutting model, previously choosen, still these operation needs to be performed in a complex way, considering some general schemas wich are determined depending on the wooden material characteristics or depending the orders that the factory needs to fulfil.
Generally there can be utilized different sistematic variants of logs sawing. These can be: through-and-through sawing, sawing with one turn or succesive turns at 90°, sawing with turning at 180°, quarter sawing and zones sawing
Afther the process of log sawging into undressed timber is done, the obtained timber pieces are subjected to the processing operations which are edging, ripping, trimming and sectioning.
The processing operations are done according to the wooden specie, and structural defects of the timber and according to necessity given by the existing orders. It is tried to be obtained an optimum quantitative and qualitative yield.
II.1.3 Thermal and chemical treatment department
In the department of thermal and chemical treatment the following operations are realized:
steaming (only for one part od the beech timber)
kiln-drying
preservation and fire-proofing
The endowment of the department with the necessary equipment like kilns, steaming chambers etc. will be done according to the quantity of timber that is estimated to be processed by these types of operations.
II.1.4 Timber yard
The timber yard represets the products storage of the factory and the department where the following operations are executed:
dimensional-qualitative grading (in green ramp) and stockstacking of timber
the stacking on strips of the timber for drying (natural of artificial)
storage for conservation and drying
final grading (in dry ramp), preparation and delivery of the timber to the customers
For the execution of these operations, the timbr yard will be endowed with different equipments and instalations for timber grading, for stacking, for unstacking and forming of the timber packets, for transport and for loading into the means of transportation.
Therefore, in the timber yard, the technological process of handling and conditioning of the timber, from the exit of it from the sawmill house until the final expedition, occures. In the timber yard we can find the beside the constructions and instalations necessary for handling and grading of the timber, passinf and handling routes, ramps and special platforms, shelters etc.
In the green ramp the preparation of the timber for storage and drying is done. These is done by a dimesional grading and a qualitative pregrading and also by the stockstacking of the realized production.
Dimensional grading is the operation done for the softwood and hardwoods timber that was previous separated considering the specie, assortment, processing grade ans destination.
The beech and oak timber is dimensional graded manuallys and also mechanicaly. It is done in the following way:
regarding the thickness – each thickness separately (8 classes) and than each thickness separated afther the processing degree (edged, unedged or half edged).
regarding the length (3 groups)
- subshort timber 0.40-0.95 m (produced only edged)
- short timber 1.00-1.70 m (edged and unedged)
- long timber 1.80-4.00 m (edged and unedged)
regarding the width no grading is done
In case of beech planks and deals already from the first phase of the grading the separation between steamed and not steamed is done.
Qualitative grading
The qualitative grading of the timber is one of the moust important steps from the technological process of timber production. The economical results of the company depend on it. Usually it is operated in two phases:
before drying (at hte green ramp)
afther drying (at the expedition ramp)
The final qualitative grading of the timberis done at the expedition ramp, because only there one can consider also the eventual defects appreared during the drying process.
Qualitatively the grading is done according to the existing standards
Mechanical grading
In the past time the utilization of timber for varoius purposes obliged the producers to give also data about the mechanical characteristics of the produced timber, in order that these can fulfil the needs of the customers.
These mechanical grading can be done either by selecting some pieces of timber from a expres quantity and testing it by distructive methods, or by means of online testing ot the timber using special machines that can test each piece of the processed timber.
In some utilisation fields the timber that was not tested mechanically can not be used from safety reasons (some applications of glue laminated timber). In the figure 27 the functioning schema of such a mechanical grading mechanism is presented:
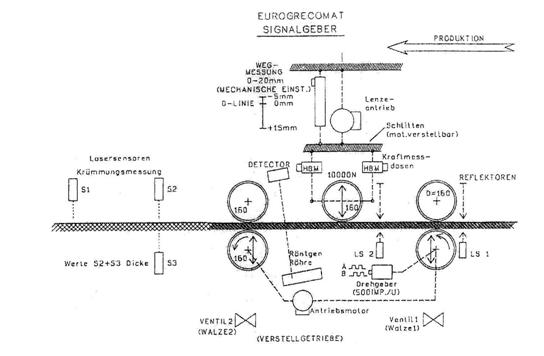
Fig. 27 The functioning schema of a mechanical testing device
II.2 SAWING CAPACITY OF THE LOGS SAWING BAND SAWS
The band saws for logs cutting are together with frame saw machines and circular saws machines for logs sawving basic equipments for timber industry and have a processing capacity which is determined by their technological and functional characteristics.
In these sense next factors need to be considered:
the rotation speed and diameter of the flywheels (respectively cutting speed, feeding speed and the return speed of the saw carriage, etc.)
the technical and functional condition of the band saw and of the equipment wich is used for it’s attendance
the mechanisation levels of the loading and positioning of the logs on the carriage
the sawing method and the number of cuts done for the log sawing
the maintenance of the band saw blades
the quality of the preparation of the logs for sawing
wood specie, moisture content and dimensions of logs
the qualofication degree of the personnel that operates the band saw and that assures the maintenance of it
The sawing capacity of the band saw machines is defined usually by the quantity of the logs sawn in unit of time and determines the processing capacity of the equipment that is attending the band saw.
The sawing capacity of logs band saws can be expressed in the following ways:
the number of logs sawn in a specific unit of time:
Qbf ![]() [buc/8h] (2)
[buc/8h] (2)
the length of the sawn logs in a specific unit of time:
Qlf ![]() [m/8h] (3)
[m/8h] (3)
the volume of logs sawn in a unit of time:
Qvf ![]()
![]() /8h](4)
/8h](4)
the surface of the cutts executed by the band saw blade in a specific time unit
Qsf 
![]() /8h] (5)
/8h] (5)
where: Qbf, Qlf,
Qvf,
Qsf represent the sawing capacities of the band
saw expressed in buc/8h, m/8h, ![]() /8h and respectively
/8h and respectively ![]() /8h;
/8h;
T – duration for which the sawing capacity is calculated, expressed in minutes (it is considered T=480 min, for one shift)
tb – is the medium duration necessary for the processing of the practical cutts at the sawing of one log
lm – the medium length of the processed logs, expressed in m
vmb
– the medium volume of the logs sawn with the band saw, expressed in ![]() /buc (determied in function of length and diameter
of the logs)
/buc (determied in function of length and diameter
of the logs)
Am – medium feeding speed of the carriage in the sawing process, expressed in m/min
k – the general utilisation coefficient of the band saw which expresses the time intensive utilization level and time extensive utilization
The coefficient k (k=0.4-0.5) indicates the share of the working time corresponding to the usefull functioning of the band saw and represents the product:
k = k1 * k2(6)
where - k1 is the functioning coefficient of the band saw (extensive utilization k1 = 0.9 - 0.95 );
- k2 is the coefficient of usefull functionig of the band saw (intensive utilization of the band saw k2 = 0.5 – 0.6 )
In conclusion a high sawing capacity of the badn saw is reached if logs with big diameters are processed (as close as possible to the maximum cutting heigth of the band saw), if high feed and return speeds are applied and if a low number of cutts are executed in order to saw a log (by cooperation with the other machines placed in the technological flow).
II.3 THE QUALITATIVE AND QUANTITATIVE YIELD OF BEECH LOGS SAWING BY MEANS OF A BAND SAW
By the sawing of the round wood into timber there is tried to be reached an as high as possible qualitative and quantitative production yield and an maximum economic efficiency. In our country the quantitative yield is of equal importance with the quantitative yield.
In order to reach a maximum qualitative and quantitative yield the following facts need to be considered:
abidance of the fabrication technology
the preparing condition of the logs (especially the debarking, washing and trimming of logs)
adequate grading and sorting of logs
the condition of the sawing equipment and of the cutting tools, a good maintenance of them
the thickness of the blades that are used at the sawing process and for the processing operations. These should be as small as possible and the kerf should pe adequate
the processing at the circular saws (especially at edging) should be done according to the quality desired for the pieces of timber, a bezel in corespondance with the other defects of the wood should be adopted.
the sawing of the curved, oval and of the logs having other defects should be realized in a manner that will assure the removal of these defects by one or two cutts.
The lossings of material during the timber sawing process are in form of: sawdust, rests, slabs and oversizes necessary for the shrinkage. The values of these lossed depend especially on the parameters mentioned above. These losses are keeped between function of wood specie and applied technology.
QUANTITATIVE YIELD:
The quantitative yield is expressed in percentages by yhe ratio between the volume of the obtained timber and the volume of the sawn logs. Thence it expresses the utilization degree of the raw material and is determined with the formula:
R = ![]() [%] (7)
[%] (7)
Where: - R is the quantitative yield espressed in %;
- Vch
is the volume of the obtained timber, expressed in ![]()
- Vb
is the volume of the sawn logs, expressed in ![]() ;
;
In practice it is
neccesary to be mentioned also the volume of logs sawn in order to obtain one ![]() of
timber. These is expressed by the consumption index (Ic)
also called specific consumption, as in the formula:
of
timber. These is expressed by the consumption index (Ic)
also called specific consumption, as in the formula:
Ic ![]()
![]() /
/![]() ] (8)
] (8)
QUALITATIVE YIELD:
The qualitative yield can be expressed either in percentages or valorical.
In percentage speaking, the qualitative yield is expressed by indicating (in percentages) of the voulme of each realized timber quality class from the total volume of the produced timber in a period of time (shift, mounth, quarter of year, etc.)
It is calculated with the relationship:
Rc ![]() [%] (9)
[%] (9)
where: - Rc is the qualitative yield, expressed in %;
- Vp the
volume of timber from a specific quality class, expressed in ![]() ;
;
- Vch the
total volume of the obtained timber, expressed in ![]() ;
;
In value speaking, the qualitative yield is expressed by the ration between the sum of different assortments of timber multiplied by the coresponding price and the total quantity of the produced timber. It is in fact the expresion of the medium price of the realized products. It is tried to reach an as high as possible level and is expressed by the relationship:
Fmedium 
![]() (10)
(10)
where: - Fmedium
is the qualitative yield (medium price), expressed in Euro/![]() ;
;
Q1,
Q2, Qn are the
volumes of different qualitative assortments of timber, expressed in ![]() ;
;
p1,
p2, pn are the
selling prices for each timber assortment (quality class), expressed in Euro/![]() ;
;
In case of logs sawing by means of band saws, the fabrication operations, the products scale and the losses for each machine from the technological flow are presented in the figure 28.
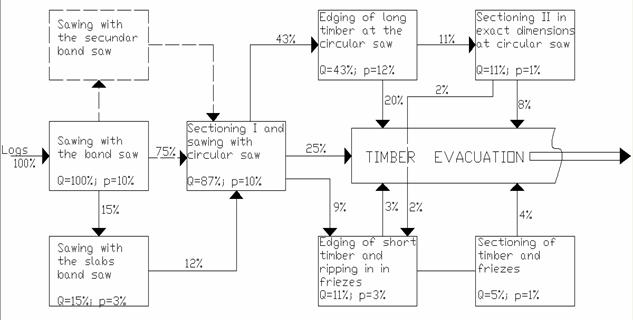
Fig. 28 The operations that are processed in case of the sawing of beech logs into timber, Q – quantities that into the processing operation, p – losses that occure
The losses scale for each operation of the sawing and processing of beech logs into timber by means band saws is presented in table 2.
|
Secon-dary resulted products |
Sawing with band saw % |
Ripping with ripping saw % |
Cross-cut I with crosscut saw % |
Edging with edging saw |
Cross-cut II with crosscut saw |
Edging and ripping of friezes |
Cross-cutt friezes at crosscut saw % |
Total |
|
sawdust rests slabs shrinkage |
7.3 1.0 3.5 |
2.3 5.2 0.5 0.7 |
1.0 7.5 1.0 |
1.0 5.5 0.5 |
0.2 0.5 0.3 |
0.5 0.5 |
0.2 0.3 0.5 |
12.5 20.5 0.5 6.5 |
|
Total: |
11.8 |
8.7 |
9.5 |
7.0 |
1.0 |
1.0 |
1.0 |
40 |
Table 2. The losses scale for each operation of the beech timber production process
The production scale for beech timber at the real moisture content is presented in table 3.
|
Raw material in cubic meter |
|
Production |
|
|
Assortment |
Proportion |
||
|
Beech logs in a proportion of Q |
Orientativ:
|
- planks and deals from which: - class A: - class B: - class C: - subshort planks and deals - friezes - scantlings, lathes |
52.5 18 26 8.5 3.0 4.0 0.5 |
|
TOTAL |
60 |
||
Table 3 Production scale for beech timber sawn with the band saw
II.4 PRESENTATION OF A CONVENTIONAL FLOW SHEET FOR THE SAWING OF BEECH LOGS BY MEANS OF A BAND SAW
The production activity in the sawmill house is indicated to be executed following a linear technological flow. These should be as short as possible and should not include returns of the materials for further processings.
A technological flow can be realized in different organizational forms depending on:
- quantity, wood specie and dimensions of the sawn raw material (maximum diameter of the logs)
- basic equipment used for sawing
- the desired degree of mechanization
- the desired qualitative and quantitative yield
- the space that is available for the production and the utilization of it with maximum efficiency
- the assurance of some optimum distances during the processing and storage sequence of operations for the machines that are working with buffer stocks (stocks that need to be reduced to a minimum or evoided)
- the optimum position of the workers towards the machines on which they work
- the minimizing of the level of the handling operations, the circulation without corssings, mixture of materials and returns of materials for processing.
- the possibilities of cooperation between several processing lines, in various processing types and in case of unexpected stops of some instalations.
- the eventually production of some semiproducts
- the choosing of some installations of attendance and transport between machines, with a high mechanization level, in order to assure a ritmic activity.
The processing capacity of a technological line is determined by the basic sawing equipment. From these reson by the design of a technological flow it is detemined the capacity of the line by the processing capacity of the basic equipment used for sawing. Afther this the number of each sawing mahines for each operation is determined and capacities of the transport, logs loading and timber and secundar products evacuation systems are calculated.
The technological flows used for sawing of hardwoods into timber by means of band saws can be organized in two ways. These will include beside trimming and edging circular saws also the following:
either three band saw machines (one basic band saw,one edging and ripping band saw and one slabs band saw)
either two band saw machines (one basic band saw and a high capacity slabs band saw).
In the second constructive variant of the technological flow the operations of the edging and ripping band saw will be over taken by the high capacity slabs band saw.
The basic operations included in the technological flow of hardwood timber production by means of a band saw are presented in fig. 29
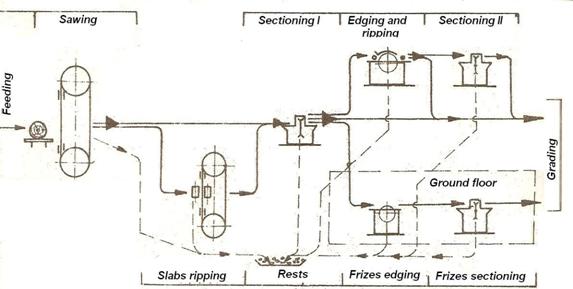
Fig. 29 Block schema of conventional hardwoods logs sawing into timber,
by means of band saw machines
For the execution of the operations included in the technological flow, at the first floor of the sawmill house, following technological lines are placed: one band saw for logs sawing, a high capacity edge band saw, more cross-cutt and sawing circular saws (sectioning I), one or two dimension cutting and ripping circular saws with self acting feed, for long timber, circular saws for sectioning at fixed dimensions (sectioning II).
The rests resulted afther the processing operations from the first floor, are passed through fall ways at the ground floor. Here these are capitalization of these materials occure, by processing of it into subshort timber or friezes (by means of circular saw machines) and also by processing it into technological wood chips.
The emplacement of the machines in the frame of the flow sheet can be done in different ways, one of these being presented in fig. 30
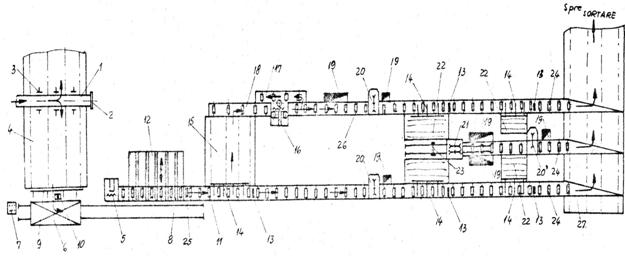
Fig. 30 The emplacement of the machines in the frame of a technological processing line for the hardwood timber production (by the conventional system)
1- longitudinal chain conveyor 2- stopper shield 3- arms unloader 4- ramp with transversal chains 5- band saw 6- logs carriage 7- control panel 8- carriage rolling track 9- device for the transfer of logs to the carriage 10- device for rotating of logs on the carriege 11- roller conveyor 12- ramp with transversal chains 13- retractable stopper shield 14- spillway arms 15- table fitted with transversal chains for stockage and displacement 16- edge band saw 17,18- free roller conveyor 19- traps for evacuation of the rests and of the materials destinated for the under short timber and friezes 20- cross-cut circular saws 21- double edging saw 22- slope tables for buffer stock 23- the carriage that sustains the long pieces 24- roller conveyors for evacuation of timber 25- retractable stopper shield 26- free roller conveyor 27- transversal conveyor destinated for collecting and evacuation of the timber from the sawmill house
II. 5 MODERN MODELS OF TECHNOLOGICAL FLOW SHEETS FOR PROCESSING OF HARDWOODS LOGS INTO TIMBER
Even if these use the usuall known technological machines (frame saws, band saws, circular saws), the modern lines used for timber manufacturing, are organized into rational flows, including a reduced number of operations and wich can be driven by means of computers. In the figure 31 the functional schema of the logs sawing process is presented:
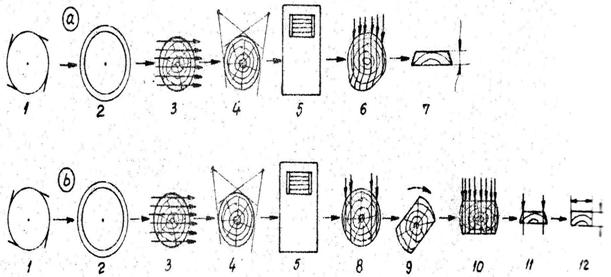
Fig. 31 The functional schema of timber production is presented
a- sawing into unedged timber b- sawing into edged timber
1- debarking 2- metal detection 3- qualitative control 4- logs scaling 5- computer
6- live sawing 7- dimensional grading (function of thickness) of the timber
8- sawing into prism of the logs 9-rotating of the prism 10- sawing of the prism
11- edging of the timber 12 dimensional grading (function of thickness and width)
Th processes registered in this domain where modernized until the complete automatization of the timber manufacturing process was realized. By the entering of the logs into the factory these are scaled automatically by different systems, of integrator or tabular type. The obtained data is send to the computer which have stored into their memory the necessary orders of the factory. Considering these facts the computer can elaborate an optimal sawing program for one certain diameter type existent in the log yard.
On request the computer can print, a series of statistical data, existent into it’s memory. These can be:
The total volume of wooden material from the yard, considering the assortments, diameter assort etc.
The quantity of timber existent into the factory timber yard, the total quantity or for each assortments separately
The priorities lists for the orders that the factory needs to process
The lists of packaging for each package of delivered timber
By the sawing processes driven by computer, there can be previously determined the necessary number of logs (with some dimensional and qualitative characteristics) that need to be sawn by means of a certain sawing model, in order fulfill the existing orders, and to reach a maximum qualitative and quantitative yield. In these case the pruchase price of the logs is corelated with the sale price of different timber assortments. These corelations conduct to an optimum capitalization of the logs that are stored in the log yard. In case of the implementation of this process into high capacity factories great results are obtained The block schema of logs sawing based on computed conducted process is given in the fig. 32
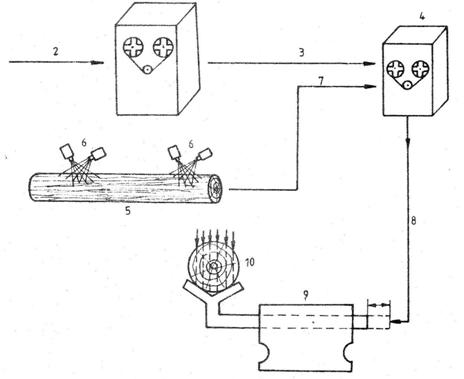
Fig. 32 The block schema of logs sawing based on computed conducted processes
1- electronical computer with medium power 2- optimizing sawing programs elaborated in function of the existing orders and implementated into the computer memory 3- elaboration of the sawing model 4- process conducting minicomputer
5- log 6- surface scanner (for determation of the log form, length and diameter)
7- system of information transmission regarding the log form length and diameter
8- codified transmitting system for the results of the chosen sawing model
9- positioning system for logs sawing 10- sawing machine afther the programe
The above schema is a basic schema that can be used for the programming activity developed in a timber factory and also for the design of new technological lines. These method realizes the connection between the form and dimensions of the logs (circuit 7) and the thicknesses requested for the timber pieces (circuit 3), the process driven minicomputer (4), deciding the optimum variant sended codified (circuit 8) to the machine that executes the sawing (10).
Bases on this principle a connection between the teoretic potential of timber production from a ideal log (form and dimension) and the real log with forms and dimensions determined by a surface scanner is realized. The elaborated sawing program represents the optimum compromise between an real and an ideal log.
In the case that the computed conducting of the sawing is desired to be extended also for the processing of timber by means of the auxiliarry machines, the next functional schema, fig. 33, can be utilizated.
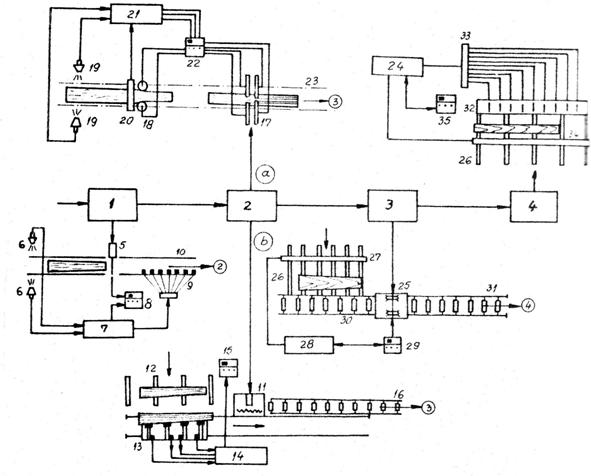
Fig.33 The functional schema for a computed conducted processing line
a) sawing by means of double band saw machines b) sawing by means of simple band saw machines;
1- trimming of the long truncks 2- sawing into timber 3- edging and ripping of the timber 4- sectinong of the timber at nominal dimensions 5- chain saw for logs sectioning of the logs 6- scaner for establishing of the form and measurement of the logs diameter and length 7- minicomputer 8- operater control panel 9- device for automatic choosing of the logs sectioning length 10- conveyor for evacuation of logs to sawing 11- sawing band saw 12- ramp with transversal conveyor for temporar stockage of the logs 13- band saw carriage 14- minicomputer 15-operator control panel 16- roller conveyor for evacuation of the timber pieces for edging 17- group of double sawing band saws (two double band saws) 18-lateral milling heads for slabbing of logs 19- scaner for determination of logs length 20- scaner for determination of logs diameter 21- minicomputer 22- control panel 23- longitudinal conveyor for evacuation to edging and ripping 24- minicomputer 25- multiple edging and ripping circular saw with on comand or automatic regulation of the edging width 26- table fitted with transversal chains for stockage and displacement of the timber pieces 27- scaner for determination of the pieces width 28- minicomputer
29- control panel 30- roller conveyor 31- roller conveyor for evacuation to sectioning 32- trimer 33- orders centralizator 34- scner for determination of the timber pieces length 35- control panel
Because the band saw machines permit a automatization of the controls needed for the choosing of the desired thicknesses, by means of computer, these are the moust utilizated machines for the modern timber processing lines (in case of softwoods and also in case of hardwoods). There is no need for the grading of the logs before sawing. These gives the possibility of high compactization and mechanization of the stock yards.
The machines layout in the frame of a technological line used for logs sawing into timber, and wich is working based on the principle of automatic adjustment of the sawing model, is presented in figure 34.
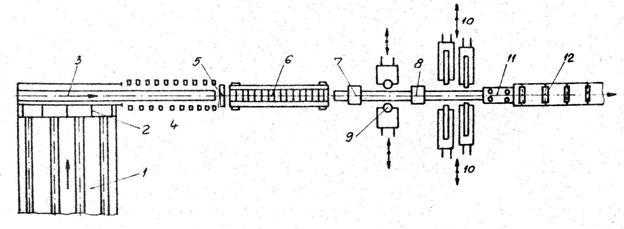
Fig. 34 Simple technological line for small diameter logs sawing
1- transversal conveyor (with stockage possibility) for log feeding 2- transfer inclined plane 3- chain longitudinal conveyor 4- device for measurement of logs length 5- device for measurement of logs diameter 6- feeding conveyor for the logs slabbing machine 7- inferior milling head 8- superior milling head 9- lateral milling head 10- group of double band saw machines 11- rolls device for the assurance timber pieces stability until the total sawing of the log is processed 12- roller conveyor for the evacuation of the timber pieces
II.6 PRESENTATION OF A FLOW SHEET FOR HARDWOOD LOGS SAWING BY MEANS OF A BAND SAW
THAT INCLUDES THE OPERATION OF LOGS INTERNAL SCANNING
As it was shown in a previous chapter and as it will be exactly calculated in the last chapter of these study, the logs internal scanning can determine great benefits.
Because of the high costs of the equipment the implementation of these processing step in the frame of modern technological lines needs to be carefully considered. The obtaining of the best results from the internal scanning of logs will direct determine the company benefits and is determined from some factors. Maybe the moust important factor is the optimal positioning of these operation in the frame of the processes included in the timber production.
The internal scanning of the logs can be realized in two ways. It can produce in the logs yard afther trimming sectioning and prunning of logs and before storage and conservation of logs. In these case the grading of the logs also considering the dimensional caracteristics and also considering the qualitative characteristics can be fully replaced by the internal scanning process. The obtained data will be send in electronical form to the timber factories that have an sawing technology adapted for the reading of these information. A computed controlled sawing line will establish optimum sawing models considering these data. Another way to benefit from the internal scanning of the logs can be realized by marking on the logs end the line of the first saw. These will not produce as great benefits as it will produce the sending of a virtual 3-D image to the saw machine, but can be applied also for technological lines that are not conducted by means of computers or which do not have the means to read and process the electronical information.
In the next figure, fig. 35, the functional schema for the logs processing in a log yard , including the operation of internal scanning, is presented.
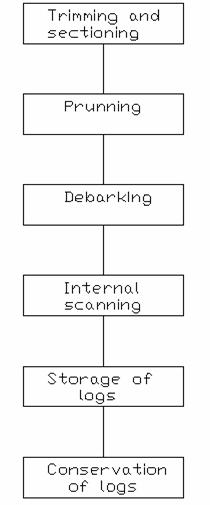
Fig. 35 The functional schema for logs processing inside a log yard
The internal log scanning not only that will give an internal image of the log but by doing that it can also replace the operation of metal detection.
The scanning of the logs inside of a log yard can be done in a yard that belongs directly to the factory that processes that logs or it can produce in a log yard that is resaling the logs to processing units.
In case of log yards belonging to a timber factory, when we calculate the efficeincy of the internal scanning operation, we need to consider the the sawing capacity of the factory, as in case of log yards that reseale the logs the processing capacity of the log yard will be considered. In case of timber processing units and also in case of single log yards there will be a better economical choice to sell the high quality logs for veneer production than to process it or to sell it for timber production.
Considering that the best results for logs internal scanning will be achieved for logs having a moisture content as low as possible, the beech logs will be scaned during the summer period in the log yard before conservation. These is compulsory because during summer period the conservation of beech logs is usually done by spraying or imersing them into wather. During the winter period the scanning of the beech logs or other logs species that suffer suffocation in the summer can be also done afther debarking and before sawing.
For wood hardwoods species that do not suffer suffocation during the summer and also for softwood species the internal scanning operation can produce also before the sawing process is realized.
The flow sheet in case of logs scanning before sawing is presented in the following schema, fig. 36
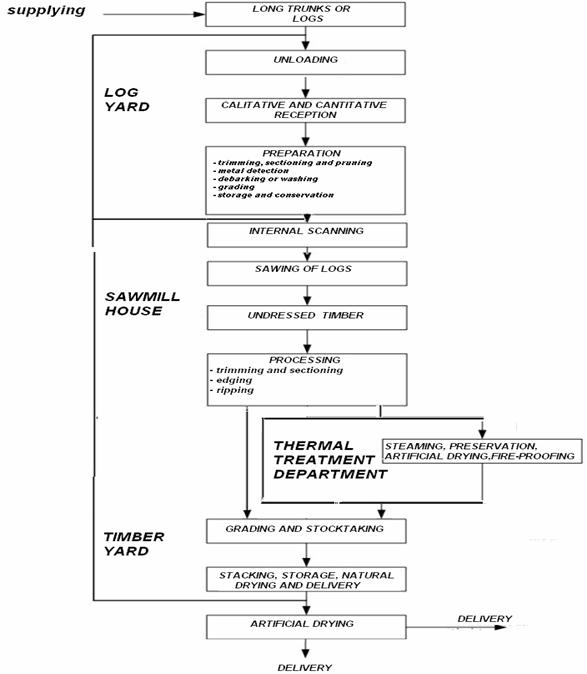
Fig. 36 Technological flow sheet for timber production, including th internal log scanning operation just before sawing
We need to mention that in case of internal log scanning just before sawing the operation of metal detection will lose from it’s importance because by scanning of logs information about strange objectes from the structure of the logs will be also obtained.

CAP.III
CALCULATION OF BENEFITS
OBTAINED IN CASE OF IMPLEMENTATION
OF WOOD INTERNAL SCANNING IN THE FRAME OF THE TIMBER PRODUCTION PROCESS
III.1 COST OF THE SCANNING DEVICE AND
CALCULATION OF THE PROCESSING COSTS
Before the potential profitability of a CT scanner at midsize mills can be estimated, more precise information is needed on the cost of a complete scanning system, scanner performance in a mill environment and its effect on production, and the impact of use of a scanner on lumber grade yields.
At the begin of the 90’s Hodges et. al. estimated the price for a CT X-ray log scanner to about 1.5-1.7 million $, still they also stated that the price of such a device will know high reductions because of the quick and permanent development and optimization of technologic, electronic and informatics sectors. They also stated that prices are likely to drop as the scanners become more common in sawmills. The price of a log scanner may eventually be lower than that of a medical scanner, since detecting log defects requires less precision than medical diagnostics. Additional costs could include those for developing software, similar to that of the Best Opening Face programs, and for a micro- or minicomputer to determine the optimal log orientations based on the log scans.
Dongping Zhu et. al. also stated in their study “CT Image Sequence Processing For Wood Defect Recognition” that the cost of a CT log scanner should be approximately in the range of the cost of the CT scanners used in medicine which was at that time of about 600.000 $. To this the expense of modifying the technology for sawmill use needs to be added.
In the information received from the Microtec company regarding the Log Eye system, dipl.ing. Martin Bacher stated that an aproximate price for such a system will reach 500.000 € excluding transport and the instalation expenses. However, there area number of good reasons to believe that the cost of industrial versions of these machines will still go down in the future.
A significant percentage of the total cost of a CT machine is the cost of the computer and special purpose hardware used to do the reconstruction. The costs of these devices decreased continously in the same time with the increase of their performances. Further memory costs have also known a decline and are still continuing to decline. Because of this special purpose hardware and minicomputer used earlier where replaced by one or more microprocessors and this will continue in the future. This is the reason why the cost of the processing units required to both reconstruct CT images as well as perform the automatic analysis markedly decreased from the 90’ until today.
Another significant cost component in today's units is the research and development (R&D) cost. A relatively high volume market, such as the one that would be associated with the forest products application, should allow R&D costs to be spread over more machines reducing this cost on a per machine basis. Finally, the spatial resolution required for either of the above forest products applications will probably be less than that required for medical diagnosis. The reduction in spatial resolution affects not only the computational complexity of the reconstruction but also the nature of the radiation source. The lower the resolution the less expensive the computational hardware and the less expensive the radiation source.
Regarding the actual processing costs we can say that the energy consumption for processing a total tomography image for a hole human body is of about 7 kW. Even if in case of logs supplementary energy consumtion is needed in order to decodify, process and to render a 3D image, because of the lower resolution needed in case of wood, we can say that the enegy consumption in these two cases of tomography is sufficient. Therefore actual value of the 7 KV needed for one scanning will be of about 0.76 €. Considering that one human body has an aproximate dimension as a 2 meter long beech log, with a diameter of 60 cm (0.565 cubic meters) we can calculate that the energy expense needed to scan one cubic meter og logs will be of about 1.3 €/mc.
Some other cost will be added to the cost of the device it’self. Hodges et.al stated that an expenditure of no more than $100.000 would be required for additional equipment and training and also an additional expense would be an annual overhead cost of $10,000 ( or about 6% of operating expenses) to cover the increase in working capital.
More than that some further expenses may occure for the personel work safety.
In conclusion we will consider that the purchase and installation cost for a CT X-ray scanner will be of about 500.000 €, to these expense other cost of about 80.000 - 100.000 € will be considered depending on the automatization level of the processing line. To these other costs a cost of about 40.000 € should be calculated for transport, installation and personnel training. Considerind additional expenses, of 10.000 €, the final cost of the product may also lead to a price of 630.000-650.000 €.
III.2 PRESENTATION OF AN ANALYSIS OF
BEECH LOGS AND TIMBER MARKET PRICE IN ROMANIA
In our country the total surface of the standing crop has reached last year the range of 6.48 mil. ha., from these surface the total of harvested wood in the year 2007 was of 17.28 mil. cubic meters. The quantity of the total romanian standing crop is of about 1350 mil. cubic meters. From these 1350 mil. cubic meters the romanian forest is structurated as following: 39% softwoods, 37% beech, 13%oak and 11% other hardwoods species.
Having a high spreading rate regarding the surfaces from Romania which are populated with beech timber, it is of highly importance to know some market prices for the beech timber and logs.
In order to be able to calculate the efficiency of the implementation of wood internal scanning for beech timber production we need to identity thr price range of beech timber logs on romanian market. We will consider the log prices for the logs of A and B category (I and II) because these are the proper qualities to be processed into timber. For these logs having diameter dimensions higher than 300 mm the prices vary in Romania from 60 € to 120 €. If we speak of logs with lower quality’s or a diameter dimensions starting from 200 mm, the log prices will start as low as 50 €.
Regarding the prices of beech timber in Romania it needs to be considered the prices of all qualitative classes and timber assortments. It’s also compulsory to mention the moistre content of the timber. For our further analises we will need the prices for green timber and these is why the given prices will have a higher importance for this type of timber.
If we consider the a minimum price for the timber having an inferior quality „C” class and a maximum price for timber having a high quality (extra A) we can include the beech timber prices in the following table, table 4. Because of the high availability and demand of oak timber on Romanian market and because the factories that produce beech timber usually process also oak into timber, in the table 4 also information about price levels for oak timber are given. The prices are given in (€)/mc.
|
Timber assortment |
Minimum price |
Maximum price |
|
Long beech timber, edged, not steamed |
200 |
280 |
|
Long beech timber, edged, steamed |
250 |
460 |
|
Short beech timber, edged, not steamed, length 1 to 1.9 m |
175 |
250 |
|
Short beech timber, edged, steamed, length 1 to 1.9 m |
210 |
300 |
|
Subshort beech timber, egded, not steamed, length 0.4 to 0.9 m |
150 |
180 |
|
Subshort beech timber, egded, steamed, length 0.4 to 0.9 m |
165 |
240 |
|
Beech frizes, green |
170 |
220 |
|
Beech frizes, steamed |
210 |
260 |
|
Oak timber, length higher than 1.9 m, fresh sawn |
490 |
800 |
|
Short oak timber, length between 1 and 1.9m, fresh sawn |
400 |
650 |
|
Frizes from fresh sawn oak |
350 |
580 |
Table 4. Hardwood timber prices on Romanian market
III.3 PRESENTATION OF S.C. FOREX S.R.L. GHIMBAV
Founded in 1990, as a company specialized in forest exploitation and wood processing, SC FOREX, expanded its field of activity, in 1991, by opening the first saw mill at Ghimbav, jud. Brasov. Since then, FOREX continuously developed, devoted to an intense investment program, which the company constantly sustains.
Because beech (Fagus Sylvatica) is the one most widely spread in the Romanian Carpathian Mountains, belonging thus to the only unpolluted woods area in Europe, it is the wood specie that, is mainly processed at SC FOREX. Because of the specific ground and climate conditions, the Romanian beech wood has a dense but mild and homogenous structure, therefore making it suitable for any kind of processing. By steaming the beech, its color can be 'adjusted' according to customer's preferences. On the other hand, the red heart - specific for the beech wood from the Carpathian area - enhances esthetically its appearance.
By using an adequate and precise cutting technique, FOREX highlights successfully all these special, natural qualities of the beech wood. As a result, the products delivered by FOREX, are standing out through their variety, quality and aspect, respecting and meeting at the same time the demands on the international wood market.
The company products are delivered dried (10-12%), lightly steamed, one length per bundle, in four thicknesses (26mm, 32mm, 38mm, 51mm), widths over 10cm and six lengths (1.85m, 2.15m, 2.45m, 2.75m, 3.05m, 3.35m). The wide range of sorts, allows SC FOREX to choose the material which is best suited for certain purposes, at a good quality-price relation, as well as at very well defined dimensional and qualitative parameters. The final sorting is done into eight qualities, after the drying process has been completed. These eight quality classes are:
SUPERIOR (S): Top quality, with practically no defects. Ensures a high efficiency when cut into long items. Suitable for all types of products (fine furniture, moldings, panels with continuous lamellas, etc.).
SUPERIOR 1 FACE (S1F): The first side is 'S' quality. On the reverse side, traces of red heart may be visible.
SUPERIOR COLOR (SC): Long items of superior quality; healthy red heart; no defects. Suitable for furniture, massive wood panels and various long profiles.
CABINET (CB): High efficiency (about 85%) when cutting into short and very short items. Suitable for finger jointed panels, furniture parts, stairs.
CUSTOM SHOP (CS): Few knots (2-3) and red heart. High efficiency when cut in medium length items (allowing small knots) or, short items with no defects (by eliminating the knots). Suitable for massive wood finger-jointed panels, parquet, short and medium length furniture parts and chairs.
CABINET CUSTOM SHOP (CB-CS): Red heart and knots on both sides. Suitable for furniture parts, finger-jointed panels, floorings, rustic furniture and toys.
COLOR (CL): Red heart and knots on both sides. Suitable for small furniture parts, non-visible frames, tapestry furniture (sofas, armchairs), rustic floorings, hidden or painted items.
COMMON SHOP (CM): Inferior, cheap quality; red heart and knots, plus core heart. Suitable for small, covered items, rustic and industrial floorings, toys, handicraftware.
When we speak about quality classes S, S1F and SC we speak about high yield in long items and no defects. Speaking about CB, CS and CB-CS quality classes we can speak about superior quality for short items and no defects. In the third case for quality classes CL and CM we can speak about specific qualities of timber intended for tapestries, handicrafts, tool shanks and dowels.
In the next picture, fig.37, the logs sawing process is presented:
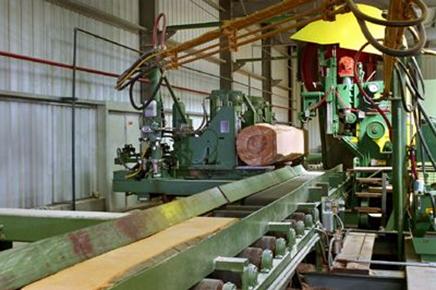
Fig. 37 Logs sawing at SC FOREX SRL Ghimbav
At the present the company has a number of 60 employees, and produces beside beech timber also stair steps of massive wood, handrails, rail-collumns, massive wood tables and different profiled slats. All the products produced at SC FOREX SRL Ghimbav are sold on the romanian market or given to export. The markets where the timber produced at Ghimbav is exported vary but between the moust important ones we can enumerate Dubai, China, England, Bulgaria etc. As other activity of the company it needs to be stated the purchasing of green beech timber from other companies, processing and drying of this and resaling it to the own clients.
III.4 CALCULATION OF THE INCREASED VALUE FOR THE PRODUCED TIMBER IN CASE OF IMPLEMENTATION OF A SCANNING OPERATION AT SC FOREX SRL GHIMBAV
Evaluating the economic potential returns from investments in computerized tomography (CT) scanners that detect internal defects in hardwood logs, we can say that, the results indicate that such investments would be profitable for large mills, even with only moderate increases in lumber value yields. For small mills, however, increases in lumber value yields would have to approach a quite higher percent for returns from an investment in this technology to reach an acceptable rate.
In order to be able to calculate the gains obtained by means of wood internal scanning, one will need to determine the sawing capacity and the qualitative and quantitative yield for a certain production unit.
In
case of SC Forex the data obtained from the company it ‘self reveals us a minimum
sawing capacity Qvf
=105 ![]() logs/8h, considering
250 work days in a year it results a annual minimum sawing capacity of about 26250
logs/8h, considering
250 work days in a year it results a annual minimum sawing capacity of about 26250
![]() logs/year.
The production capacity of the timber factory is of 15225
logs/year.
The production capacity of the timber factory is of 15225 ![]() timber/year.
timber/year.
Regarding the quantitative yield Rc, also from the data provided from the company we are informed that the company produces aproximative 60 cubic meters timber/day. These data gives us the possibility to calculate a utilization degree of the raw material of (formula (7) ):
R = ![]() %
%
and a yield (formula (8) ) of:
Ic ![]()
Considering the qualitative yield for the products produced by SC FOREX we need to consider all the quality classes of the produced timber and frizes. The class Superior (S) would correspond to the quality class “A”, the classes Superior on face (S1F), Superior color (SC), Cabinet (CB) and Custom shop (CS) would correspond to the quality class “B” whereas the classes Color (CL) and Common shop (CM) will fit for quality class “C”. Also frizes are produced for these being sorted with the name of X class.
Considering
the timber quality classes we can say that annually there is produced a
quantity of 1583 ![]() S class timber, 2755
S class timber, 2755 ![]() S1F class timber, 3197
S1F class timber, 3197 ![]() SC class timber, 3045
SC class timber, 3045 ![]() CB class timber, 2892
CB class timber, 2892 ![]() CS class timber, 1141
CS class timber, 1141 ![]() CL class timber and 456
CL class timber and 456 ![]() CM class timber. There is also produced a quantity of
about 304
CM class timber. There is also produced a quantity of
about 304 ![]() X class timber produced.
X class timber produced.
Speaking
in percentages we can say that from the whole quantity of 26250 ![]() produced
timber/year 10.4% represents S class timber, 18.1%
represents S1F class timber, 21 %
represents SC class timber, 20 % represents CB class timber, 19 % represents CS
class timber, 7.5 % represents CL class timber and 3 % represents CM class
timber. The amount of frizes represents about 2% of the total quantity.
produced
timber/year 10.4% represents S class timber, 18.1%
represents S1F class timber, 21 %
represents SC class timber, 20 % represents CB class timber, 19 % represents CS
class timber, 7.5 % represents CL class timber and 3 % represents CM class
timber. The amount of frizes represents about 2% of the total quantity.
By means of formula (9) we can calculate the qualitative yield for each timber quality assortment as follows:
for S class: Rc=![]()
for S1F class: Rc=![]()
for SC class: Rc=![]()
for CB class: Rc=![]()
for CS class: Rc=![]()
for CL class: Rc=![]()
for CM class: Rc=![]()
in case of firzes we have: Rc=![]()
Regarding the quantitative yield value also called medium price this can be calculated by means of formula (10):
Fmedium =
![]()
= ![]()
![]()
If we consider the usual quality classes beech timber, respectively quality classes A, B and C we will have 10.4 % timber class A, 77.1 % timber class B, 10.5% timber class C and 2 % frizes. In this case the medium price remains unchanged but we are able to determine a qualitative yield function of these three quality classes:
- for
class A: Rc=![]()
- for
class B: Rc=![]()
- for
class C: Rc=![]()
In case of frizes the qualitative yield remains unchanged.
Regarding the increased value of timber in case of internal scanning implementation, we need to consider the increase of qualitative yield obtained by scanning of logs. Schmoldt et al. in the study prsented in year 2000 in Austria afther applying of an internal scanner prototype at a sawmill in Austria recovered great qualitatve increases. In their study they could perform an increas of 40% from timber class B to timber class A, and an increas of 19% from timber class C to timber class B. Even if these result shown great succeses these can not be 100% concludent for the given situation because the wood species of the logs sawn in Austria where softwoods.
The study of Hodges et. al also presents without specifing the exact increases for each timber quality class that increased of 15-18% can be achieved in case of beech wood sawing.
Teischinger and Muller susteined in a study presented in year 2001 that the increase in quality can be of about 10-11%. In this case not mentions where given regarding the quality classes of timber or the processed wood species.
All the above studies speak about implementation of internal log scanning for a factory where the automatization is 100%. Gains could be obtained not only by internal scanning itself but also by other aspects. These could be the exact calculation of the cutting model regarding not only the internal structure of logs but also the outher surface, curvature and dimensions of the log. Advantages can be obtained also by the exact scaling of the processed logs, by a better metal detection, by a decrease of the labor costs by decrease of the operator work or even the substitution of the operator etc.
Concerning the optimum orientation of logs before sawing Richard et.al. 1969, Richards et.al. 1980 and Wagner et. al 1990 demonstrated in their reports potential value gains of 11%, 14% respectively 21%. Combining the advantages of optimum orientation of the log and knowledge of the log internal structure one can obtain higher potential gains.
Considering the situation from SC FOREX SRL Ghimbav we will be able to calculate an potential gain only regarding the calculated medium price and we will be able just to make some assumptions regarding the increase o yield for high value lumber quality classes.
We will calculate the potential gains only regarding the medium price Fmedium we will obtain an increase of 30,08 €/cubic meter timber. This was calculate with a performance of just 10% given by the internal scanning operation. Considering the calculated 30,08 €, the processing expense for internal scanning/cubic meter equal with 1,3 €/cubic meter timber and other expenses (general expenses, indirect expenses) that where considered 0,5 €/cubic meter timber we obtain a benefit of about 28,28 €/cubic meter timber.
Potential gains/![]()
![]()
![]()
If we calculate the obtained gains considering the total annual production capacity we will obtain an increased value of 430684,8 €.
Potential gains/ annual production:
![]()
![]()
The above calculus is not quite exact because it is presumed that also the price of the A class timber will increase. This assumption is incorect because the A class timber can not „raise” to a higher quality class therefore it’s price will stay at the known level also for the scanned pieces of timber.
If
we consider an increase of the quality yield from class B to class A or from
class C to class B of 10% we will obtain a percentage of 20,4% timber class A or
87.1% timber class B. In these case the increase of value will be from an
average price of 300 €/![]() for timber class B to a price of 460
€/
for timber class B to a price of 460
€/![]() for timber class A, or from a
price value of 130 €/
for timber class A, or from a
price value of 130 €/![]() for timber class C to a value of
300€/
for timber class C to a value of
300€/![]() for timber class B.
for timber class B.
In the
first case 1522.5 ![]() class B timber will know a price value
increase of 160 Euro this will consist of a benefit of 243.600 Euro. In the second
case if the 1522.5
class B timber will know a price value
increase of 160 Euro this will consist of a benefit of 243.600 Euro. In the second
case if the 1522.5 ![]() timber class C will know a price value
increase of 170 Euro we will gain a
benefit of 258825 €.
timber class C will know a price value
increase of 170 Euro we will gain a
benefit of 258825 €.
Considering the processing costs for the logs scanning we need to subtract this from the two sums above. In order to obtain these benefits we will need to scan the entire quantity of sawn logs. Knowing that the cost of logs scanning will be of about 1.3€/mc scanned logs we can calculate a total of 34.125 € as processing costs for scanning. Subtracting these sum from the sums above we will obtain 209.475 € in the first case and 224.700 € in the second case.
Knowing the anisotropy of the wood we will probably never be in the situation to identify an increase in value only for the C class timber or only for the B class timber, therefore an average between the two sums that could be obtained would be probably more close to the sum of the gains that could be achieved in practice. This sum will be obtained if the amount of timber class A will increase with 5% and the amount of timber class B will increase also with 5%.
In this last, more practical case the amount of the possible achieved gains would be of 217.087,5 €/year.
Considering the other advantages that the logs internal scanning can produce one can say that the given can be also higher after the actual implementation of internal scanning at SC FOREX SRL Ghimbav
III. 5 ANALIZE OF EFFICIENCY OF THE IMPLEMENTATION
OF SCANNING TECHNOLOGY FOR THE BEECH TIMBER FACTORY AT SC FOREX SRL GHIMBAV,
REGARDING THE INCREASE OF TIMBER VALUE AND AMORTIZATION OF INVESTMENT
Because of the high cost of an investment for a scanning technology all details should be carefully considered before making this step. In order that an investment is optimum or not it should not only produce benefits regarding its usual utilization but it needs also to cover successfully its acquisition costs.
As estimated before the price of the scanning technology together with the installation and training of the personnel will reach to a level of 630.000-650.000
In case of SC FOREX SRL Ghimbav such an investement should be sustained and amortisated by the obtained gains estimated previous at aproximative 217.000 € anually.
In order to confirm and justify the investment in a log scanner at SC FOREX SRL Ghimbav, an evaluation of economic efficiency and a project fundamentation was realized. This was done by means of the static indicators. This evaluation has a high importance because it reveals informations concerning the investment project.
As soon as the recovery of the investment is realized and as soon as these are reinserted in the production circuit, their growing and functioning speed is higher and so the economic efficiency becomes also higher.
The inconvenient of the static indicators utilization for the evaluation of the investment efficiency is represented by the fact that it does not consider the implications of the time factor, but these indicators constitute a basis in the evaluation of investment efficiency by means of dinamic factors.
The static evaluation of investments assures the actual information concerning the investment, data and indicators that constitute a fundamental basis for any investment project.
Therefore the exchange rate given by BNR at 30.05.2008 for € was : 1 EUR = 3.62 RON.
Informations concerning the economicall and technological state of SC FOREX SRL Ghimbav :
The estimated anual volume of
scanned logs : 26250 ![]() /year
/year
A. Indicators with general character
1. Sawing capacity:
From the presented data from SC FOREX SRL Ghimbav we are
informed about a daily sawing capacity of Qvf =105 ![]() logs/8h.
Considering the quantitative yield of 0.58 we can calculate a production
capacity of 60
logs/8h.
Considering the quantitative yield of 0.58 we can calculate a production
capacity of 60 ![]() timber/8h.
timber/8h.
Considering 250 working days/year
we obtain a sawing capacity of 26250 ![]() logs/year and a production
capacity of 15225
logs/year and a production
capacity of 15225 ![]() timber/year
timber/year
Afther the realization of the investment in a log scanner the sawing capacity will remain constant, the quantitative yield may know some improvements but the qualitative yield will be improved with a gain of 10% minimum.
2. Number of employees:
The number of working personeel at SC FOREX SRL Ghimbav may know periodic modifications, but it does not vary very much. Considering al sectors of activity the company has a number of 60 employees.
3.Processing costs:
The processing costs to scan 1 ![]() logs was calculated as beeing 1.3 €/
logs was calculated as beeing 1.3 €/![]() log and considering the
quantitative yield of 0.58 the processing costs equals 2.24 €/
log and considering the
quantitative yield of 0.58 the processing costs equals 2.24 €/![]() timber.
timber.
4. Sale price:
The sale price for timber will know a increase of 160 or
170 €/![]() for a amount of 10% of the B
or C class timber.
for a amount of 10% of the B
or C class timber.
5. Production value of scanning (Vp):
The production value of the scanning operation will express the gains obtained by scanning. These will vay between 420.000 and 446.000 Euro.
Considering strictly the timber sawing and selling activity the company will register an income of Vp=4.580.960 € by implementation of the scanning operation the value of the total income will grow to a level of Vp2=4.798.047 €
6. Profit (P):
The profit obtained by scanning can be calculated as:
P = Vp2 – Vp = 4.832.172 4.580.960 € = 251.212 €/year
7. Rentability (r):
Regarding the profit obtained by scanning we need to mention that from the total income of 251.212 € we need to subtract the actual processing costs (PrC) of 1.13 €/mc log. This will be PrC=34.125 €. In this case the actual profit will be
Pr = P - PrC = 251.212 €– 34.125 € = 217.087 €
The rentability can be calculated as following :
Where : - Pr = profit
- C = incomes concerning the scanning operation (P)
B. Basic indicators:
1. Investment value (total investment) It:
In case of SC FOREX SRL Ghimbav the total investment value reaches the level of It = 650.000
2. Investment execution time (d):
The duration of the investment time can be only estimated and we can consider it of 3 mounths.
3. Functioning time (Df):
Because of the fact that the technology is not in function but just at the prototype stage we can not give a certain life time for the technology. Nevertheless we can mention that given the high price of the investment the scanning device and equipment should be functional for a duration beeing as high as possible. From this reason we will consider the functioning time as beeing of minimum 15 years.
4. Machine capacity (scanning capacity)
The scanning capacity of the scanner excedes the sawing capacity of the processing line, from this reason we will consider the scanning capacity equal with thw sawing capacity of the band saw.
![]()
5. The duration of investment recovery time (D):
The duration of investment recovery time can be calculated with the formula :
![]() years
years
Where: It = total investment
Pr = net profit
6. The coefficient of economic efficiency of the investment (E):
It is calculated with the formula :
![]()
In the table 5 all economical efficiency indicators are presented:
|
Indicator |
Simbol |
Value |
|
1. Investment value |
It |
650.000 |
|
2. Functining time |
Df |
15 years |
|
3. Duration of investment recovery time |
D |
2,99 years |
|
4 Coefficient of economic efficiency of the investment |
E |
0,34 |
Table 5 Economical efficiency indicators
III.6 CONCLUSION AND DISCUSSION
Considering the data presented in this study I hope that I could present the latest notifications in the field of wood internal scanning.
The study shows the great potential that this operation can bring for wood industry and economy in general. It also brings a model for determination of the efficiency of an investment in wood internal scanning for a small to medium beech timber processing unit in Romania.
The European reality in which we live has shown us that only knowing the latest technology and only by application of it with the best results we are able to compete on more and more exigent market.
The small advantages that the wood industry in Romania still has regarding the industries from other countries, inexpensive manpower, lower prices for raw materials, higher availability of raw materials etc. will disappear rapidly and the competition with other companies will increase.
The utilization of wood internal scanning can be in the future one of the only choices remaining for optimization of logs sawing and the utilization of it with highest benefits will depend on the information that receive.
This study determines that utilizing prior knowledge of internal log defects will increase lumber value, and therefore, investing in CT scanning equipment for hardwood sawmills is warranted. Research has also demonstrated that basing sawing decisions on a knowledge of internal log structure can increase lumber value yields significantly, and that CT scanners can detect the major classes of internal defects in logs.
The major restriction converning the investement in a future log scanner will be the aquisition price. More than this it will be more efficient in the same time with the increasing of the sawed log species and otained timber products.
We can say that the economically efficiency of the investment strongly positive and that such an investment at SC FOREX SRL Ghimbav is more than indicated.
BIBLIOGRAFY
|