ALTE DOCUMENTE
|
||||||||||
INTRODUCTION OF MRTG AND RRD TOOL
MRTG architecture and related components
MRTG [1] is a network management application that can monitor any remote network host, which has the SNMP [3] protocol support enabled. MRTG, as a SNMP based application, runs SNMP requests against the target hosts on a regularly basis.
Originally MRTG was designed to acquire bandwidth information related to the network interfaces on a network host. Currently MRTG can interrogate a host about any supported SNMP OID and construct the variation graph. More than that, the new versions of MRTG are able to extend beyond of SNMP capabilities and collect numerical information from any host that collects and stores this kind of information (for more info on the new capabilities visit the MRTG and RRDTOOL [4] websites). This presentation will focus on the SNMP capabilities of MRTG.
A network-distributed deployment of MRTG can be represented as in figure 1:

Figure : A
network-distributed deployment of MRTG
MRTG acquires the SNMP information performing the following tasks:
Interrogates the remote host and gets the value of the specific SNMP OID.
Updates the variation graph with the new values and deletes the old graph. The graphs are images in PNG format. The new variation graph is stored in a location, which can be local or remote on a dedicated MRTG storage server.
Stores the new value in the log file. The log file can be located on the local host or remotely on a MRTG storage server.
The classic version of MRTG builds the graphs immediately after a new SNMP value is acquired and does not store any historical data for future reference.
The newer version comes with a very flexible database support where historical data can be stored for as long as we configure the database size. MRTG does not generate the variation graphs when a new SNMP value is acquired, just stores it in database, making the whole process faster. The graphical variations are generated "on-demand" using dedicated scripts.
MTRG requires the following components:
Perl interpreter needs to be installed on the MRTG machine. As MRTG is a Perl written application, it requires the Perl interpreter. A free copy of Perl can be obtained from https://www.activeperl.com/
MRTG package. A copy can be downloaded from https://people.ee.ethz.ch/~oetiker/webtools/mrtg/pub/
A Web Server is required on the local machine or on a remote machine (distributed installation) in order to make the MRTG graphs available over the web/http. Apache web server comes in free versions for Windows/Linux platforms. A free copy can be downloaded from: https://www.apache.org/
How does MRTG work
The original MRTG program was a Perl script which used external utilities to do SNMP queries and to create GIF images for display on the HTML pages. When MRTG was published on the Internet in spring 1995, it spread quite quickly and people started using it at their own sites. Soon, however, user feedback highlighted two key problem areas: scalability and portability. While MRTG worked fine when monitoring 10 links, larger sites ran into performance problems. At De Montfort, the intention was to monitor the off-site Internet link and maybe one or two links between buildings; performance was not a limiting factor. External users pointed out that some sites had much larger monitoring needs and were running MRTG right at its limits. MRTG logged its data to an ASCII file, rewriting it every five minutes, constantly consolidating it, so that the log file would not grow over time. The log file did only store slightly more data than was needed to draw the graphs on the web page. The graphs were converted to GIF format by piping a graph in PNM format to the pnmtogif tool from the PBM package. This setup limited MRTG to monitor about 20 router ports from a workstation. A second obstacle for potential users was that MRTG required snmp get from the CMU SNMP package. This package proved to be rather difficult to compile on various platforms at that time. This all changed when Dave Rand <[email protected]> got interested in MRTG and contributed a small C program called rateup. Rateup solved MRTG's performance problem by implementing the two most CPU intensive tasks in C and thus moving them out of the MRTG Perl script. Rateup did the logfile rewriting and the graph generation. Rateup initiated the development of MRTG-2.x. First, the original MRTG was modified rateup to use Thomas Boutell's GD library which enabled it to generate GIF files much faster than pnmtogif. Second, the SNMP portability problem was solved by switching from CMU's snmp get to Simon Leinen's Perl SNMP module [3], written in pure Perl and thus making it virtually platform independent. After almost a year of beta testing and the implementation of many user requested features, the result of these efforts was released as MRTG-2.0 in January 1997. The following are some keys characteristic of MTRG-2:
Simple Setup: The configuration is done through simple ASCII text files. An additional tool helps creating an initial version of the configuration file, tailored to a certain router.
Easy Maintenance: Because the logfiles are automatically consolidated on every run and therefore do not grow in size, the system can work unattended for months without running out of disk space.
Friendliness: The HTML pages created by MRTG are easy to understand and give a good visual representation of the network load, providing a sound basis for decisions about upgrading network links.
Integrated Solution: MRTG performs all the tasks required for traffic monitoring. No external database or SNMP packages are required to make it work.
The Round Robin Database Tool.
The main problem areas in MRTG-2 are the following:
Performance: MRTG-2 can not monitor more than about 600 router ports in a 5-minute interval, which is due to the way the log files are updated as explained above.
Flexibility: While MRTG-2 is quite configurable in general, this seems to make the users especially aware of the areas where configurability is limited, in particular when using the program to monitor time-series data other than network traffic.
The fact that people started using MRTG for tasks it was never designed for, going to great lengths tweaking it to get what they wanted, showed that MRTG offered a unique feature by integrating data collection, storage, consolidation and visualization in single package. The goals for MRTG-3 were therefore set to be flexibility and speed. MRTG-3 moves away from being an application for monitoring network traffic only. The new MRTG will be a toolkit to build applications which monitor large numbers of diverse time-series data sources using a fast data logging facility. It will be able to create a wide variety of graphs, based on data gathered from one or several sources. A parallel SNMP gatherer will help to increase the efficiency of the SNMP data gathering process. The time-critical parts of MRTG-3 are implemented in C, while the glue of the package remains Perl. This allows the users to tailor the package to their needs without recompiling it.
Development of MRTG-3 started with the implementation of a completely new mechanism for data storage. It is called the Round Robin Database (RRD), which gives a clue on how data is stored. The data handling as well as the generation of graphs is implemented in a C program called rrdtool. It can either be called from the command line or through Perl bindings.
The Round Robin Database is so much faster and more configurable than MRTG-2 that a number of people have started to use it in their own custom monitoring applications without waiting for the remaining parts of MRTG-3 to be written. After some discussion on the MRTG developers mailing list it was decided to spin off the rrdtool into a new package separate from MRTG-3, as it is a complete and useful product all on its own.
Existing software is more useful than planned features. Therefore the remaining part of this section will focus on the Round Robin Database Tool and touch on the other features of the MRTG-3 package only at the very end.
Designing a new file format offered the possibility to include a host of features to make the new logfile not only faster but also much more flexible than the old text-based logfile from MRTG-2.
The RRD format uses doubles for data storage. This gets rid of the integer overflow problems seen when monitoring really fast routers with MRTG-2 and it allows to log small numbers like the load of a machine without scaling.
The RRD can also store unknown data values. Which allows it to distinguish between situations where the data input is zero and those when no new valid data can be obtained.
Parameters like the number of log entries, the resolution of the log and the number of data sources to log in parallel are configurable.
The data values in the RRD are stored in native binary format. This makes access to the data more efficient, because no conversions are necessary anymore. A cookie in the header of the RRD is used to test if the RRD is compatible with the architecture it is being read from.
Data storage in an RRD is a multi step process. Figure 2 shows a simplified schematic of the new database design and update procedure.
Figure : MRTG-3/RRD update procedure.
An RRD can be configured to accept data from a number of data sources in parallel. A data source can be anything, be it an octet counter or the output of a temperature sensor. Each RRD operates at a configurable base time resolution. All data coming from the data sources is re-sampled at this resolution. The re-sampling of the data takes care of the problem that it is not always possible to get new data at the desired point in time but further processing and storage is much simpler when the data is equally spaced along the time axis. Figure 3 shows the re-sampling process for a counter type data source at a 300 second interval. Counter values may arrive at irregular intervals, but data can only be stored in the RRD at fixed interval. The re-sampling ensures that data points are available for every 300 second interval while the size of the area below the curves is kept constant. The basic idea behind improving logging performance was to reduce the amount of data which has to be transfered between memory and disk. This is achieved by storing data in a round robin manner into preallocated storage areas called Round Robin Archives (RRA) inside the RRD. Each Round Robin Archive has its special properties for time resolution, size and consolidation method. The update interval of an RRA must be a multiple of the base update interval of the RRD. Several values at the RRD's base resolution are consolidated into one value at the RRA's resolution using the consolidation method defined for this RRA. An array of pointers identifies the most current entry in each RRA, such that only one write operation is necessary to update an RRA.
Figure : Data
resembling process for a counter type
data source at a 300 second interval.
| rrdtool create demo.rrd --step=300 DS:COUNTER:400:0:1000000 \ DS:GAUGE:600:-100:100 RRA:AVERAGE:1:1000 RRA:AVERAGE:10:2000 \ RRA:MAX:10:2000 |
Listing 1: Setting
up a new Round Robin Database.
One Round Robin Database (RRD) can contain any number of Round Robin Archives (RRA). For Example, one RRA could be configured to store data at the base resolution of the RRD for a few days, while another one stores the daily averages for 5 years. It is also possible to configure an RRD which mimics the data storage properties of an MRTG-2 logfile.
The time to update an RRD with new data values is roughly proportional to the number of Round Robin Archives it contains plus a constant part for reading the header portion of the RRD and time-aligning new data values.
To help guarantee data quality, the RRD format allows to specify validity conditions like the minimum update frequency required or the minimum and maximum values allowed for a data source. If a condition is not met, the data supplied is regarded invalid and an unknown data value is stored in the RRD.
The new design allows to store in the order of a thousand data values per second in a Round Robin Database. This rate drops dramatically if the RRD file is accessed via NFS or if the disk cache of the machine is too small compared to the number of RRD files involved in the test. The potential NFS and cache memory problems aside, not much difference was seen between a Pentium 120 running Linux and a Sparc Ultra Enterprise 2 running Solaris at 200 MHz. A direct comparison with MRTG-2 is not possible because MRTG-2 integrates the graph creation into the data logging process.
MRTG-2 is focused on traffic graphs. Most parameters of these graphs are hard-coded. The graphing engine of the RRD Tool, however, is as flexible as the new RRD format. It allows to produce graphs of any size, spanning an arbitrary time period and to draw data from a number of data sources stored in different RRDs.
Whenever possible, the graphing engine determines sensible default values for its configurable parameters, allowing the user to concentrate on the fine tuning. Almost every aspect of the graph's visual appearance is configurable by overriding the automatic default values. Often configuration is not necessary, because the RRD Tool has several functions which automatically tune features like axis labels and scaling to fit the displayed data.
Figure : A sample
graph from RRD Tool
showing some of its features.
The graphing part of the RRD Tool also has some built-in analysis capability. It can calculate the maximum, minimum and average values from any data source. For more complex requirements, it is possible to use RPN math on any number of data sources and then graph the result. Figure 4 shows a sample graph demonstrating some of the capabilities of the RRD Tool.
Monitoring generic SNMP OIDs with MRTG
In today's complex network of routers, switches, and servers, it can seem like a daunting task to manage all the devices on network and make sure they're not only up and running but performing optimally. This is where the Simple Network Management Protocol (SNMP) can help. SNMP was introduced in 1988 to meet the growing need for a standard for managing Internet Protocol (IP) devices. SNMP provides its users with a "simple" set of operations that allows these devices to be managed and monitored remotely.
Figure 5 shows the SNMP architecture. An SNMP service/daemon runs on a device and serves out MIBs (Management Information Base). A popular UNIX SNMP server (but definitely not the only one) would be net-snmp. Cisco routers all have SNMP services as do all load balancers mentioned. An SNMP server has a "community string" which is like a password to get or set information. Most devices have a "read" or "public" community string, which enables read-only access to MIBs, as well as a "write" or "private" community string that will allow to read and to set certain parameters via SNMP. For the purposes of these discussions, we are only concerned with the read-only aspect of SNMP.
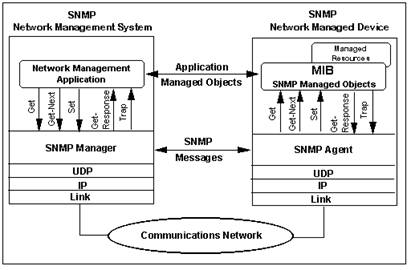
Figure : SNMP Architecture
A MIB is a collection of variables and other info that are programmed into an SNMP service. MIBs have a text file that contains the OID and a description of the info found in a particular OID. An SNMP service may have many MIBs compiled in. For instance, all the SNMP devices discussed have a standard MIB that gives out OID information on network ports. This MIB is known as the IF-MIB (RFC-1213).
The information is presented in a universal format, regardless of whether or not its a Sun machine, a Cisco router, or a toaster with an Ethernet card.
Vendors often create their own MIBs to report specialized data unique to their products. Most of the load balancer vendors out there have MIBs that relate to SLB functions and metrics, and those are the basis of this site.
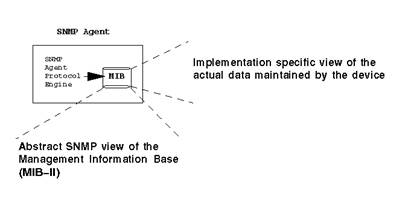
Figure : MIB architecture
An Object is a specific metric that can be measured and polled through SNMP. The most popular object is the byte counter for network interfaces. This standard object is in just about every SNMP-enabled device (via the IF-MIB), and it is a counter for bytes (also known as octets) in and out of a Layer 2 network interface. Other objects can include the connection counter for a load balancer (to measure connections per second), or CPU utilization.
The Object Identifier (or name) of an object is the sequence of non-negative Integer values traversing the tree to the node required. Allocation of an integer value for a node in the tree is an act of registration by whoever has delegated authority for that sub tree. This process can go to an arbitrary depth. If a node has children then it is an aggregate node. Children of the same parent cannot have the same integer value
Here is an example, from an Alteon MIB:
slbStatPortMaintNonTcpFrames
MRTG has the ability to monitor any SNMP OID that a host can deliver. MRTG tasks are running based on the options present in the configuration file. A configuration file is required for each (or multiple) monitored targets. It contain the <target> option tag that describes the OIDs that MRTG will ask a target host for. The format of the <target> option tag is:
> target[target-generic-name]: OID1&OID2:comunity-name@IP-address
The OID1 and OID2 are the data sources (DS) and they correspond to the original Input and Output values (the standard MRTG functionality of Input/Output bandwidth for a network interface).
OID1 & OID2 may have the following values:
OID1 and OID2 are different OIDs - if you want to graph two different values per graph.
o Example: Collect logical disk C and logical disk D free space OIDs and draw them on the same graph
o > Target[10.0.0.1 -disk-cd]: .1.3.6.1.4. 1.311.1.1.3.1. 1.5.1. 4.6.48 . 58.48.5 8.67.5 8&1.3.6 .1.4 .1.311 .1.1.3. 1.1.5 .1.4. 6.48.5 8.48. 58.68. 58:public@ 10.0.0.1
OID1 and OID2 are one and the same OID - if you want to graph only one value per graph. In case when you want to represent a single OID per graph it will be represented by OID1 while OID2 (it is the same as OID1) can be ignored when drawing the graph (see paragraph 9.2)
o Example: Collect logical disk C free space only.
o > Target[10.0.0 .1-disk-c]:.1.3.6. 1.4.1.311 .1.1.3.1.1. 5.1.4.6.48 .58.48.58 .67.58&1 .3.6.1.4.1.3 11.1.1.3.1. 1.5.1.4 .6.48.58.4 8.58.67 .58:pu [email protected]
The following diagram explains the structure of a configuration file:
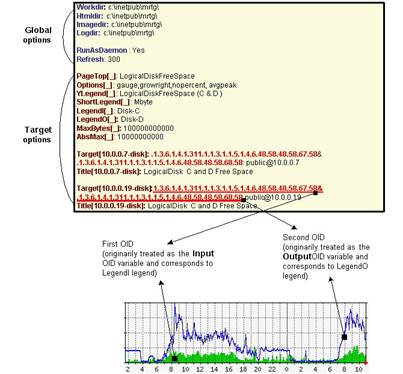
Figure : The structure of a configuration file
MRTG offers a complex set of option tags to be used in the configuration file. When multiple targets share a single configuration file (multiple interfaces of the same host), the config file can be written in an efficient manner by specifying the target options that are the same for all targets immediately after the global options and using a " _ " as target generic name. For more information, please have a look at [4]
|
