Profile of a Winning System
At this point in the development of your system, you have a clearly defined direction in which you are heading. You've decided on the system type and market type you are going to trade, and you have a feel for the types of patterns on which you want to capitalize. Now is the time for a brainstorming session in which you should sit down in front of your computer with TradeStation. This is the point at which you start to develop the set of rules that actually make up your trading system.
Many traders at one time or another have become frustrated with system development. Not because they don't like it, but because they run out of new ideas to test, or haven't found anything that works for them.
For example, most traders have tested the Dual Moving Average Crossover System sometime in their trading career. The average trader will look at this system and believe that the only thing to test is the length of the two averages. New traders will experiment with many different lengths for the averages. When they don't find any that work to their satisfaction, they discard the dual moving average system concept entirely, and move on to something else. They keep looking for that Holy Grail indicator that they can instantly make into a system. We have all been there, and have all discarded many great ideas.
The discarding of an idea, more often than not, is a mistake. I believe that for the most part, any indicator can be made into a profitable system. Yes, I said any indicator. When we discard the moving averages, it is usually a mistake because the moving averages by themselves only represent one half of the system development puzzle. I refer to this half as the "Set-Up" of a system.
The second half of a system, the half that most traders ignore completely, is what I call the "Entry." In this chapter, I will talk about exactly what these two terms mean, and more important, how using them together can turn something as mundane as a moving average crossover into a promising new trading technique.
The Magic of Set-Up and Entry
My experience is that the secret to successful system development is to look at a method, or indicator, in an unconventional manner. The trick is to use it in a different and unique way.
With Set-Up and Entry, you will look at system development in a completely different way. As you'll soon see, it can provide you with a whole new world of exciting possibilities and ideas to test. It will lift you out of the rut of simply optimizing standard indicators and give you a method of organizing your creativity.
THE SET-UP
The Set-Up is the condition or set of conditions that are necessary prior to considering taking a position in the market. It is the indicator or group of indicators 24424h724y that tell you to get ready to buy or sell. Set-ups don't get you in the market, they simply make you aware that a trade is in the making.
Examples of set-ups for a trend-following system:
. A fast moving average crossing a slow moving average
. The ADX indicator in an up-trend
. Prices moving outside of a price channel Examples of set-ups for a support and resistance system:
. The RSI moving into oversold territory (below 20) or into overbought territory (above 80)
. SlowD crossing SlowK when using the Stochastic Indicator
. Prices reaching the upper or lower line of a moving average envelope
Examples of set-ups for a volatility expansion system:
. An opening price gap over the high of the previous bar
. The current bar's range is greater than the average range of the last three bars
. The difference between two moving averages on the current bar is greater than the average difference of the last 10 bars
There are countless other indicators and conditions that could be used as set-ups. In the final analysis, you are limited only by your creativity. There is only one constraint that you should impose upon yourself. It is essential to recognize the type of system you are trying to develop and use the different indicators accordingly. You do not want to use a moving average crossover for a support and resistance system unless you are using it in a unique way. You would not choose to use the Stochastic Indicator for a trend-following system unless you had completely re-configured how it is used.
Most system traders do not recognize that these indicators only set up the trade. They are unaware that there are a multitude of ways to actually get in the market once the set-up has occurred. They are not aware that set-ups are only part of the equation and are not particularly profitable in and of themselves.
Beginning system developers get discouraged when they try to develop profitable systems from set-ups only. They quickly run out of ideas to test, because they use up all their ideas as set-ups without trying to combine them with various complementary entries.
By trading only set-ups, you lose the added precision, accuracy and increased profitability of a system that uses both set-up and entry. If trading set-ups by themselves worked, and was profitable, trading would be easy and all traders would be rich.
THE ENTRY
An entry is the signal by which the system purchases the contract in the market. It is the technique that I use to take a market position once the rules for the set-up have been met.
Entry selection is dependent on the type of set-up you've designed. You may choose to trade a trend-following system, an S/R system, or a volatility expansion system. The entries are designed differently depending on the type of system you choose to trade.
Many beginning traders devise systems that only trade entries. These are not as effective and are usually less profitable than systems that utilize both a set-up and an entry. Systems based only on entries tend to have too many trades and a low percentage of profitable trades. There are two rules to which all entries must adhere:
Entry Rules:
1. Prices should confirm the direction indicated by the Set-Up before a taking a position
2. The Entry should guarantee that a system will capture every price move for which it is designed
Entry Rule #1 requires prices to move in the expected direction before entering the market. If our set-up indicates a long position, we would require the price action to move up in some specified manner before we would be comfortable taking a position. We want the price action to confirm the set-up and force us into taking a position.
For instance, let's assume that on today's close our set-up has given us a long signal. We might require a breakout above the high of today's bar to confirm that the market is in bullish mode. With this breakout as a condition of entry, we have now required specific market action in the direction of the set-up before we risk taking a market position.
Some examples of buy entries are:
. A buy stop on tick above the current bar's high
. A buy stop over the highest high of the last three bars
. Buy at market after several consecutive up closes
. Buy at market after a close over the previous bar's high
. Buy on a close that is greater than the open
. Buy on a stop, one tick above the last swing high
. Buy at the market on the close of a key reversal bar
Note: Key reversals are a common and intriguing pattern. In an up key reversal the low of the
current bar is lower than the previous bar's low and the close of the current bar is greater than the previous bar's close. In a down key reversal is the opposite. The theory is that this bar indicates an attempt by prices to continue lower but instead they have reversed and closed higher, which denotes a change in trend.
When deciding on what type of signal to use as your entry, it is important to keep in mind the type of system you are trying to create. There are certain types of entries you don't want to use with set-ups because they have basic flaws that may allow the system to miss the big move.
Entry Rule #2 is to make sure that our entry guarantees that we will be in on every move that the system was designed to catch. The strength of this guarantee is the criteria by which I judge the viability of all entries. I consider an entry flawed if there is even a slight chance that there could be a big move that the entry would miss. This is a very important system development principle that you should think about.
For example, you do not want to use a key reversal signal as the only entry for a trend-following system. There is absolutely no assurance that once the trend setup has occurred that a key reversal will follow. It is possible that after the moving averages have crossed, giving us a buy set-up, the market may very well embark on a long up-trend without as much as once having a key reversal bar. Without the key reversal bar, we would not enter the market even though the trend set-up has given us a signal. Without the key reversal bar, we will miss the big move. And as you now know, missing the big move is the worst outcome for the trend trader.
Another example of a faulty entry is an entry that consists of three consecutive up or down closes. There is no guarantee that given a set-up, this pattern will occur. The market may embark on a long trend without having three consecutive up or down closes in a row. It is possible that a trend-following system with this entry could miss the big move, and this possibility is a flaw in the system design that should be avoided.
That is not to say however that key reversals or consecutive closes should not be used. You could compensate for their shortcomings as entries by including an additional entry or entries in the system that would serve as a backup. The entry or combination of entries must guarantee that the system will be in the market should any large trend develop.
TYPES OF ORDERS
The only limit to creating viable entries is your creativity. There are potentially many techniques that make interesting entries. However, entries are also dependent on the type of order used. There are four basic orders that are commonly used for entries: Market orders. Stop Close Only orders. Stop orders, and Limit orders. Not all of these orders are available on every exchange. You should check the exchange you will be trading on for a list of the available order
types.
Market Orders
A market order is used to enter the market without any restrictions on what the price should be. This order is commonly placed on the open of the day (market on open) or close of the day (market on close). However, market orders may also be placed anytime during the day by calling your broker and either buying or selling "at market." Although market orders fulfill the criteria for Entry Rule #2, they are deficient because they violate Entry Rule #1.
It is my view that market orders (market on close, market on open) are not entries at all. They are simply the obvious and easiest way to put on a trade.
Market orders may be turned into viable entries by adding another condition to them that will signal an implied direction. For example, an effective use of a market order would be to "buy tomorrow at market if the open tomorrow is greater than the high of today." This forces the market to indicate a direction, presumably in the direction of the set-up (in this case up) before we enter the market.
A market order may be used to enter the market, but should always be used with at least one more condition in order to fulfill Entry Rule #1.
Stop Close Only Orders
Stop Close Only (SCO) orders are market orders with an important twist. The twist is that to enter long, the market must close above a price that we have preselected. For a sell, the market must close below our pre-selected price.
An example is to buy a contract on the close at 856.30 SCO. This means that if the price closes at or above 856.30, the market will fill your order at the market. The idea is that with an SCO order, you have placed an important restriction on the market order, making it a viable entry. This forces the system developer to find a price that the market must close above (or below) before the system takes a position. By placing this restriction on a market order, we have turned it into a valid type of entry.
Stop Orders
The easiest way to create a valid entry is to use a stop order. By its nature, a stop requires the market to pass through a certain pre-selected price before a contract is bought or sold. Using a non-removable stop order is the best way to create innovative entries and confirm the entry rules.
The reason stop orders are generally superior to SCO orders is that they guarantee that your system will enter the market regardless of when during the day the price is hit. You will not have to wait for the close and you may catch a big intra-day move that would be lost if you waited for an SCO.
An example of using a stop order as an entry is the bar breakout entry. If today our set-up turns bearish, we would place a sell order one tick below today's low. Unless prices move below this price, forcing a confirmation of the set-up, the system would not take a short position in the market. The same mechanics would hold true for a long signal.
Stop orders that are not removed are also the best guarantee that the system will be in for the big move. Placing a permanent sell stop (good until cancelled) below the current price provides the best assurance that you will be in on any move beyond that price. The floor brokers must fill your order as soon as they can once that price is hit. This guarantees you will be in on the move, although there is no guarantee as to the exact price (this difference between the stop and the fill price is slippage, which will be discussed in detail in a later chapter).
Limit Orders
Limit orders are the opposite of stop orders. By their nature, limit orders require prices to be traveling in a direction opposite the set-up.
The primary intent of the limit order is to place a resting buy order somewhere below the present market price. This is an attempt to pick off a lower and better price than where the market is currently. You may also place a resting sell order above the current price to sell at better than current prices. Limit orders are primarily used in support and resistance systems and are generally not effective.
Assume that the market is now trading at 258.00. The mechanics of a limit order are to place an order to buy a contract or share at 256.50 limit (or better) or sell at 258.50 or better (limit). This means that the floor brokers who are filling your order will only attempt to sell your contract at a price equal to or above 258.50. If the broker cannot sell the contract at or above the price, you will not be in the market. The same strategy is used with the limit buy order.
The limit order does not conform to Entry Rule #1 because it does not force prices to move in the direction of the set-up before entry. There could be a case in which a lower limit price was not reached before the market took off in a big up move.
Even if the market by chance should hit this price, there still is no guarantee that the broker will be able to fill the price. Unlike a stop, which becomes a market order at the prescribed price, a limit order must be filled at or better than the prescribed price. The market may trade at that price for only one or two trades, and then move away quickly. If your broker is not the fastest broker, you may not get filled even though the market traded at your prescribed price.
Limit orders violate both Entry Rule #1 and Entry Rule #2, therefore, I do not recommend them for use as an entry.
Testing the Set-Up
Let's pick a set-up and test it, and then see if we can't improve on it by adding an entry. The simplest set-up I can think of is a simple one-line moving average. Let's make it very simple and buy when the moving average turns up and sell when the moving average turns down.
In TradeStation terms, a moving average has turned up if today's moving average is greater than yesterday's moving average, and the average is giving a sell signal if the current bar's moving average is less than the previous bar's moving average.
Take a look at Chart 1. It is a weekly chart of Coca-Cola ( ) from 1992 to 1996. I've included the 30-period moving average on the chart.
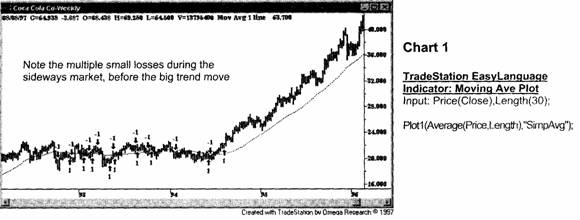
The system I've included buys when this moving average turns up and sells when this moving average turns down. Note in Chart 1 that went through a directionless period in 1993 to mid-94 and then took off on a trend in mid-1994. This is characteristic of a trend-following system, losing money in the choppy period then making it back in the trend.
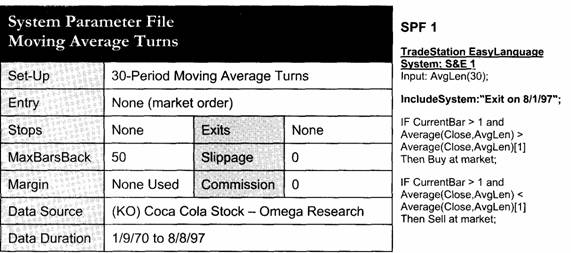
There is one important aspect of these tests that you should note. I have included a different line in the system. Include System: "Exit on 8/1/97." As 8/1/97 is the last data point on my chart, I wanted the system to exit on that day. If it doesn't, the system results may include a large open position. A large open position on any test makes it very difficult to compare results from different systems because the open trade equity is not included in the Performance Summary results.
Look at PS 1. It is a Performance Summary of the 30-period moving average system, without the Include System line.
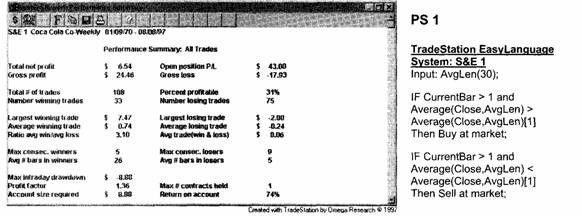
You can see that the last trade has a very large profit of $43 per share compared to the results from the last 27 years of $6.54 per share. This was the last long trade from 8/12/94, which you can see in Chart 1.
If we run another test of a system that had all trades closed since 8/12/94, it would be hard to compare the two systems' performance because one would have a large open trade and the other may or may not. The summaries would not be comparing apples to apples.
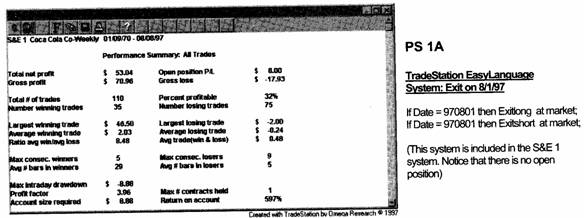
To remedy the situation, I wrote the small additional system that simply exits the market on the last data point (8/1/97). If I include this system in all comparable tests, every system will be flat on the last date, which ensures that all of the performance data will be comparable.
If you look at PS 1A, which includes the system, you can see that there is no open position. The Performance Summary is created with the last trade exiting on the last date in the test.
The remainder of the tests in this chapter will include this code so that we can compare all of the systems as if they had exited on the last day.
How did this system do? Well, not so great. As you can see in PS 1A, $.48 a trade is not a great average, especially considering that we did not include our usual slippage and commission of $.50 per share. If we had, the system would have lost money. I have previously noted that the last trade was a $43 profit. Without the last trade the system would have looked like PS 1. This is even worse. So we should just throw this out and look at something else, right? Wrong!
The problem with this system is that it only trades the set-up. There is no entry, or what I would formally call an entry. A market order, for me, is not a valid entry. Unless a market order has any other conditions attached to it, it should not be used as an entry. The flaw in this system is that it does not use a valid entry technique.
If you recall, there are many different ways of creating an entry. The most common is to use some sort of bar breakout technique. I have also mentioned several times that the best way to create a system is to use indicators in ways that are unconventional. For me, that means using indicators as entries when they are commonly used as set-ups, or as a set-up when they are commonly used as entries.
In this case, I was looking at an indicator called %R. This is an overbought/oversold indicator that is commonly used as the set-up in support and resistance systems. Chart 2 shows %R at the bottom of the chart.
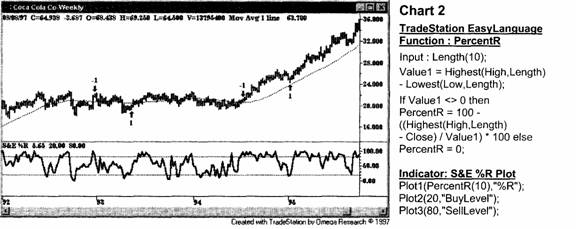
PercentR tells you where the current price is in relation to the designated range. In this case, we find the highest high of the last 10 bars and the lowest low of the last ten bars. We then calculate the percentage of the current price as compared to the range of the last 10 bars. If the highest high was 20 and the lowest low was 10 and the current price is 16, PercentR would be 60%. If the current price were 14, PercentR would be 40%.
Conventional usage of PercentR would suggest its use as a set-up in support and resistance systems, similar to how we used the Stochastic Indicator as a set-up in Chapter 3, Markets, Systems & Time Frames. The buy set-up occurs when %R gets below 20 and the sell set-up occurs when %R is above 80. SPF 2 shows the parameters of this system.
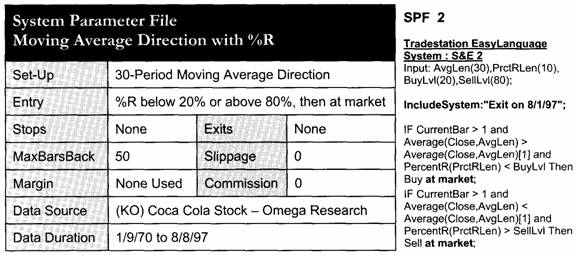
However, as I was looking at this chart, I thought that instead of using %R as a set-up, I would try to be creative and use it as an entry. Therefore, our long set-up would be the 30-period moving average moving up, and the entry would be %R being below 20%. The short set-up would be the 30-period moving average moving down, with %R being above 80%. Chart 2 has this system applied.
If you compare Chart 2 to Chart 1, you can see that the number of trades taken during the sideways market was reduced dramatically by the addition of the entry. This is very positive. The one thing we want to do with trend-following systems is reduce our cost of trading through the choppy market. The Performance Summary for Chart 2 is shown in PS 2.
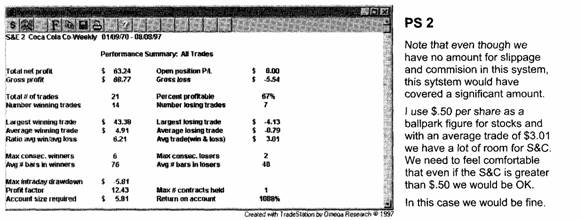
In addition, as you can see from comparing PS 2 to PS 1A, the results were significantly improved. The profit increased from $53 to $64, percent profitable increased from 32% to 67%, the average profit per trade increased from $.48 to $3.01, MAXID (maximum intra-day drawdown) down from $8.88 to $5.81 and the ROMID (return on MAXID) went up from 587% to 1088%.
Even though the performance is improved, is this a good entry? Does it confirm the direction of the set-up? No, %R being low goes against the trend, and a market order does not confirm the direction of the set-up. So it violates Entry Rule #1.
Does it guarantee that the system will catch every big move? No. It is possible that a big trend move could occur without %R ever getting in the buy or sell range. Thus, it also violates Entry Rule #2. Knowing this, I always check a system to see if the bar breakout entry I mentioned earlier, in place of the market order, improves the system. I did so here as well. The results can be seen in PS 3.
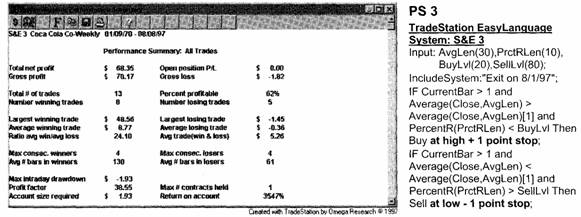
Compare PS 3 with PS 2. You will notice that the MAXID has all but disappeared. As such, the ROMID has moved up to over 3, 500% and we have moved the average trade up to over $5. All this improvement with just changing the entry from a market order to a bar breakout. The SPF is exactly the same as SPF 2 except that we use a bar breakout rather in place of a market order.
Now we have three conditions that must be met in order to get into a long trade. The first is the 30-period moving average being in an up-trend, the second is PercentR is below 20%, and the third is that the price breaks above the high of the previous bar while PercentR is below 20%. Looks great, we're done, and we have a great system. Right?
Not quite! As I looked over the TradeStation chart of the entries and exits of the system, I noticed something that bothered me about it.
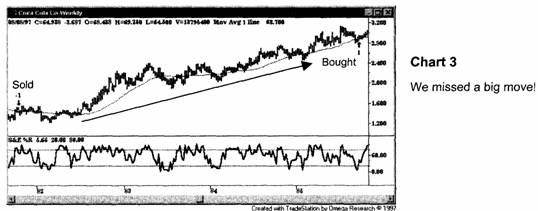
As you look at Chart 3, you will see a short trade in late 1981 that loses a significant amount of money as the bull move starts. The system sells short at around $1.40 and reverses to long at $2.80. This is a 100% loss! The loss is masked in the Performance Summary by the fact that after adjusting the back data for splits, the stock price was very low so the loss per share looks minor. The key is that while it is minor on a per share basis, it is huge on a percentage basis.
But there is something even more important. We missed the big move! Here is a situation where the price of doubled and we were not in. In fact, we not only missed the move, we were on the wrong side of the move, short the whole way up! We must conclude that this entry still violates Entry Rule #2.
This is a major flaw in a system that looks great when you only look at the Performance Summary. Since we missed a big move, and we were creating a trend-following system, we know that we are not done. Even though the numbers look great, we have found a major flaw.
I recommend that you use TradeStation to scroll through the chart with the system on it, looking at the entries and exits. You will be amazed at what you will find and what you will learn about how indicators, set-ups and entries work and the flaws in your current design.
It is clear from looking at this trade that there is a real possibility that the set-up moving average could be moving up, %R could be below 20%, and we would never get a bar breakout on the upside. Then, when %R moves back above 20%, our orders are cancelled, as the bar breakout would only be in force while %R is below 20%. We need to fix this.
As it currently exists, TradeStation only permits the bar breakout to occur while %R is below 20%. If PercentR moves above 20%, the bar breakout order is cancelled. This is what causes us to miss this big move. One way to fix this is to direct TradeStation to enter the market if %R moves above 20% once it has been below. This would ensure that every time %R was below 20%, we would enter long when it moves above 20%. The results of this change are shown in PS 4.
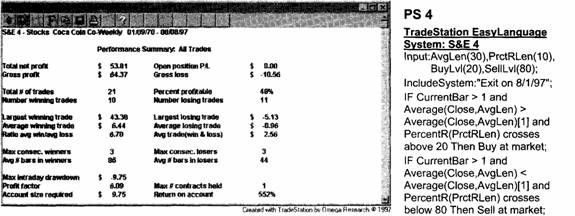
When we compare PS 4 to PS 3, we find some improvement. Profit is about the same, the percent profitable improves, and the average trade improves. However, the MAXID increases, which makes the ROMID about the same for either system. In my view, the performance is about a wash, but the system is dramatically improved and my confidence level has gone up. We have corrected a major flaw in the system, which caused us to miss a big move.
Look at Chart 4, which represents PS 4. The trend move depicted between the two arrows was so strong that %R never got oversold. If it doesn't get below 20, we will never get long, and as in the above example, would again miss the big move. We need to fix this problem as well.
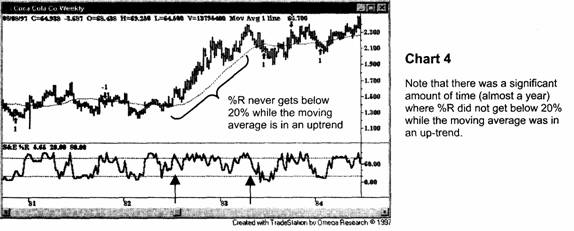
The problem is that when the trend is so strong, %R may never get below 20%, or the reverse could be true, that a downtrend might be so strong that %R never gets above 80%. In either of these scenarios, if we use %R as the entry, we will miss the big move.
The solution is to try to be creative again. But this time instead of fooling around with %R, let's try adding another entry. So, in addition to %R let's put in another entry that will ensure that we will never miss a big move, but will be far enough away that it will not interfere with the %R entries.
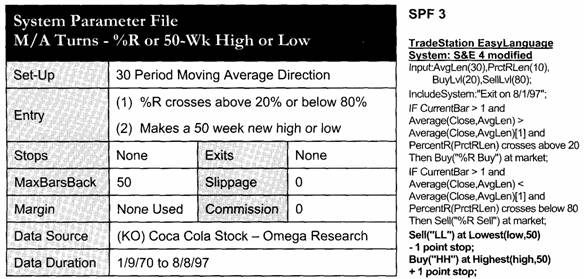
When in this situation, the first thing I try is simply inserting a failsafe buy point above the highest high of the last year, and a failsafe sell point below the lowest low of the last year. This would ensure that no mater what happens with the moving average and %R, I will get long if the prices make a new yearly high, or get short if the prices make a new yearly low.
In this case, I chose the last 50 bars, which on a weekly chart is close enough to a year for me. This entry will definitely guarantee that we will not miss the big move, which meets the criteria for Entry Rule #2. The resulting system is shown in SPF 3.
We have come a long way with this system, making the entry meet the two entry rules. Let's see the results with the additional entry; they're shown in PS 5.
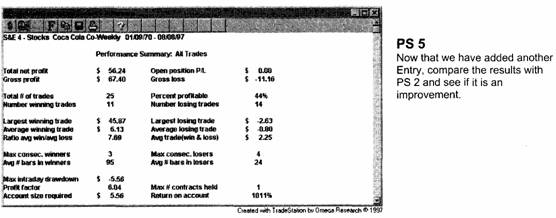
The results are much better. We should compare this Performance Summary with PS 2 as all of the interim tests had flaws in them that have been corrected.
The MAXID is reduced, and the ROMID is back over 1000% and close to where we started at 1088%. The largest winning trade is still a majority of the profits, but no worse than the original. The profit factor and average trade are both worse than the original but still respectable. Is this an improvement over PS 2? Yes, all in all this looks like it could be the beginnings of a winning system.
But let's look one more time at the chart (Chart 5) to make sure that we fixed the problem that has plagued us, that is, missing the big move. We want to make sure that we have corrected this problem once and for all.
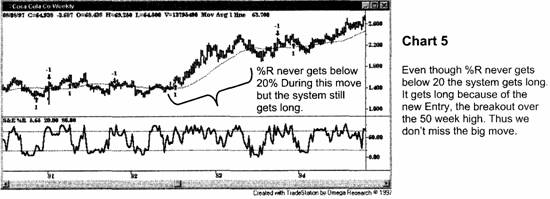
When we scroll through the chart with TradeStation, we see that we didn't miss any of the big moves. The failsafe entry over the 50-week high and below the 50-week low worked.
Is this really a good system? Let's leave that for a more detailed discussion in Chapter 8, The Science of System Evaluation. For now let's just look at PS 6, which is a Performance Summary of the long trades only. How would the system look if we take out this trade?
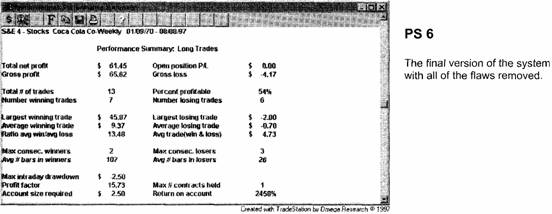
First of all, we notice that most of the losses come from short trades, as does most of the drawdown. This would stand to reason, as the biggest trade is one of the most recent trades, coming from the big bull market of the mid-90s.
One way of testing the robustness of a system is to eliminate its biggest winning trade. PS 1 is very close to what this system would look like without the largest trade and if you don't include the open trade profit. It doesn't look very good until you realize that the largest trade also occurred during the biggest bull market in history.
Remember that trend traders try to minimize losses in directionless markets until the big bull market comes. If we use this principle to measure the effectiveness of this system, it did quite well. The system held its own until the big move came, and then it made the big money on the big move. The system performed as it was designed. However, we would have needed a lot of patience since it took 20 years for the huge move to come!
Evaluating each Component
In this chapter I introduced the concept of set-up and entry. The basic premise is that most new system developers do not organize their systems in this manner. They use either set-ups or entries, but not both. Using a set-up or entry on its own generally does not work. The power comes when you combine the two. I also introduced two rules for ensuring that entries were effective.
One of the summaries I always like to look at is a short table of each of the components of a system and the final system itself. I like to look at how the set-up performs on its own, and the profitability of the entry or entries by themselves. Table 1 is that comparison.
The table is a summary of the performance of the different indicators and techniques that I used to construct our system for trading Coca-Cola. With this table we are able to gauge what the different characteristics are of each and what they add to the mix. Is the whole greater than the sum of the parts?
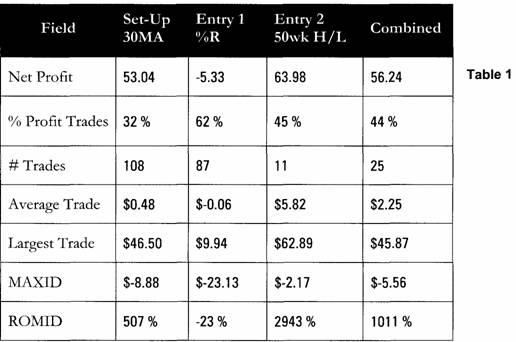
The item that stands out most in Table 1 is the profitability of buying the 50-week highs and lows on their own. What a great return! Unfortunately it all came from the last trade. Without that trade, there would have been almost no profits for twenty years and then one profitable trade. Also, I like to have at least 25 and optimally greater than 30 trades to ensure that the statistics are meaningful. Although our final system only has 25, that is within my range of acceptability. It is far better than the 11 from the 50-week breakout entry, which is not acceptable.
When I am working on a system and see something that is interesting but doesn't meet my expectations, like this 50-week breakout entry, I make a note to explore it at a later date. I expected that the results of the three systems would be worse than the combined, and they were. But the results of the 50-week breakouts were so interesting, even with only 11 trades, that we should pack this technique away for further exploration.
Except for the last trade, the combined set-up and entry system is the most reasonable of the four. It has the most reasonable average trade because it is the least dependent on only one trade. The MAXID is also in the acceptable range. The ROMID is in the middle of the range as well, but I don't give ROMID as much weight as the other characteristics because the MAXIDs are so low to begin with.
All in all, for actual trading I would have more confidence in the system we developed than the three components. In this case, set-up and entry, and its rules, worked its magic with these indicators and gave us a better system than any of the components could deliver. By a better system, I mean one that I could trade with confidence.
Ultimately, the question you have to ask yourself is could you trade this system? Could you trade and stick with the system we have designed? Just because the system is profitable and meets our system development criteria does not mean it is one we could or would want to trade. Just because it is profitable does not mean that you are emotionally able to trade it. I know so many traders that create or purchase very profitable systems, but because their personality doesn't match the system, they still lose money, all the while lamenting the fact that they can't stick to the system.
Summary
Trading the set-up and entry concept and making sure that you follow the rules gives far superior results when compared to trading either set-ups or entries by themselves. Using both a set-up and an entry together enhances the performance and profitability of a system. Here's how I like to summarize how you should think about set-ups and entries:
AIM WITH THE SET-UP PULL THE TRIGGER WITH THE ENTRY
I always use the concept of set-up and entry to develop systems. There are two distinct parts to system writing and keeping these two components in mind will help you to organize your thoughts and design a sound strategy. Above all, this blueprint for system development opens up a whole new range of possibilities for us to test.
|
