Module 4 - Planning
Table of Contents
Using Data Spreading for Planning
Detail Planning "Sales" for 2005
![]()
In this module you will learn how to use different distribution mechanisms (planning). These mechanisms are implemented on the TM1 Server; as a consequence you can use them in all front-ends (Server Explorer, Excel, ISB und TM1 Web).
You are a controller in
Take the P&L5D cube and create the following view. Save it as Plan_P&L
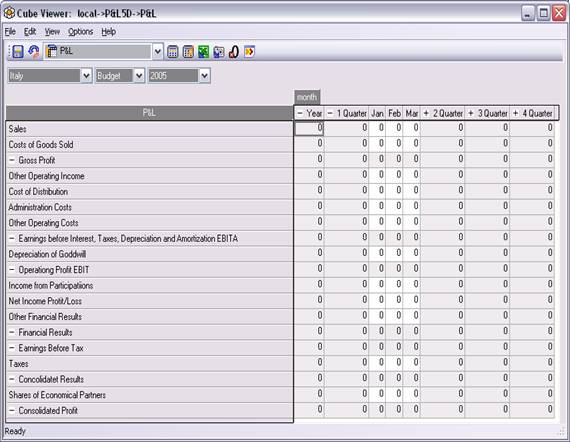
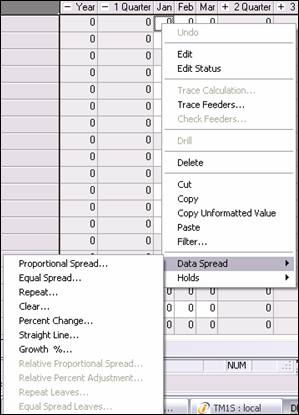
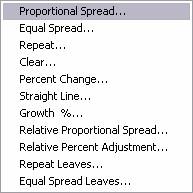
Put the cursor on any cell in the column Year and click the right mouse key. Now choose Data Spread in the context menu. You can decide between couples of different methods of data spreading.
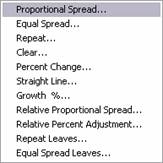
The Proportional Spread method
distributes a specified value among cells proportional to existing cell values.
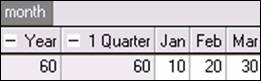
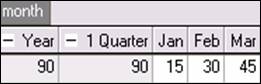
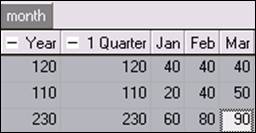
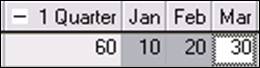
For example, consider the following view in which the values for sales in the
month Jan,
Feb and
Step 1
Select the cell or range of cells from which you want to initiate data spreading (1 Quarter)
Step 2
Right-click Data Spread Proportional Spread
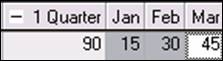
The Proportional Spread dialog box appears. Enter the value you want to spread in the Value field. If necessary, select Extend options to specify the direction for the data spread. In the majority of cases the direction is right. This depends on how you define your views. It is possible to replace existing values, as well as adding and subtracting from these values.
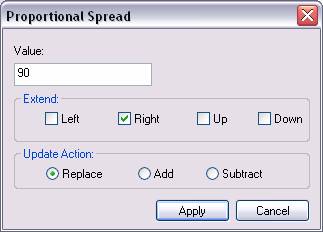
We want to distribute to the right and replace the old values.
![]()
![]()
![]()

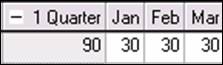
The Equal Spread method distributes a specified value equally across cells in a view.
Calculation:
You want to spread equally in the first quarter. Therefore you have to mark Jan, Feb and Mar, right click and choose Equal Spread in the context menu.
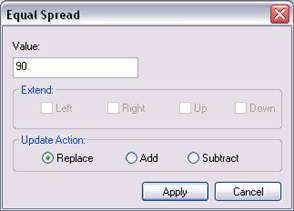
Now the values have been spread equally.
The Repeat method repeats a specified value across cells in a view.
Example:
You want to write in Jan, Feb and Mar at the same time.
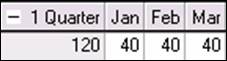
Choose Jan, Feb, Mar and the distribution method Repeat. Enter the value in the Value field and click Apply.
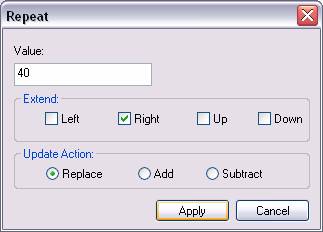
TM1 repeats the value you entered in the directions you specified or across the range of cells selected.
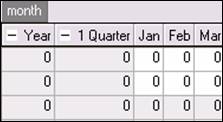
Clearing is simple. Choose a range .
Use the context menu .
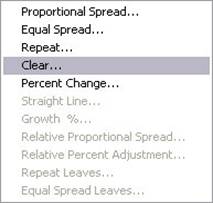
. clear.

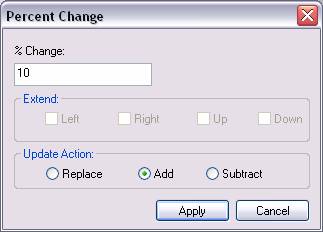
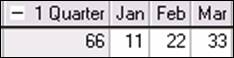
The Percent Change method multiplies current cell values by a specified percentage. The product of the multiplication can then replace, be added to, or subtracted from existing cell values.
The following situation is considered:
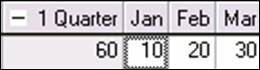
You have Jan=10, Feb=20, Mar=30 and you want to increase these values by 10%. Select the range from Jan to Mar.
Choose Percent Change in the context menu:
![]()
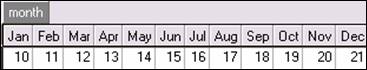
The Straight Line data spreading method fills cube cells by linear interpolation between two specified endpoints.
Assume it is known that tangible assets are 10 in Jan and will be in Dec. You have a straight
line from 10 to 21 in the pre-selected months.
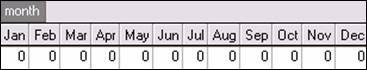
Select all 12 months and open the Straight Line dialog.
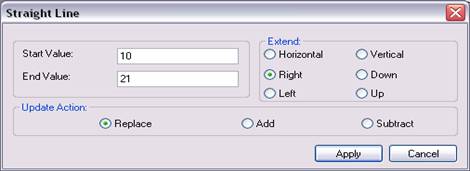
Enter 10 and 21, choose replace and click Apply.
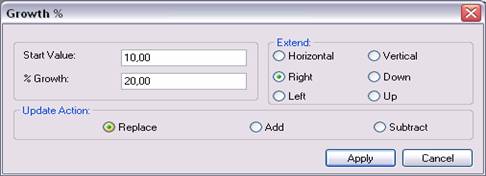
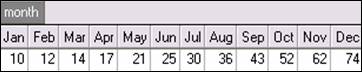
The Growth % method needs an initial value and a growth percentage. Using the initial value as a starting point, this method then sequentially increments all values in a range by the specified growth percentage.
Initial situation:
Step 1: Choose month Jan!
Step 2.
Right-click and select Growth %
Step 3.
Result:
The Relative Proportional Spread method spreads values to the leaves (children) of a consolidation proportional to the leaves of a reference cell.
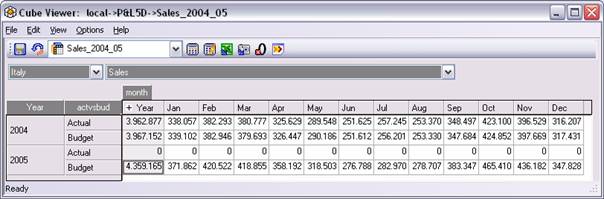
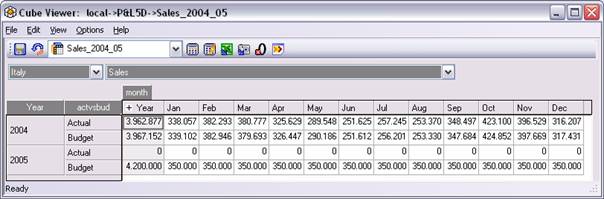
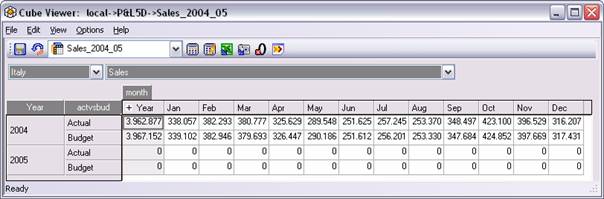
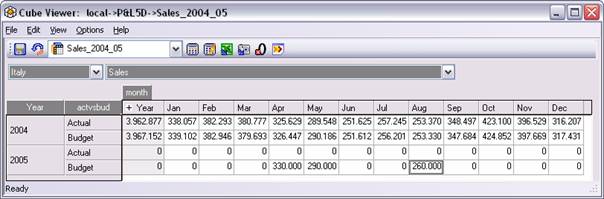
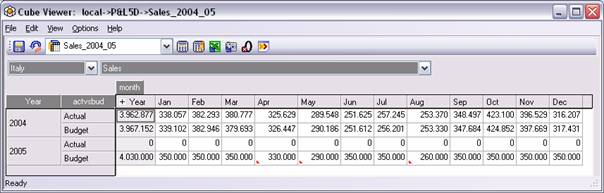
Exercise: Create the view Sales_2004_05

You want to conduct the planning for 2005. The values should be distributed as in Actual 2004 but the consolidated value Year should increase to .
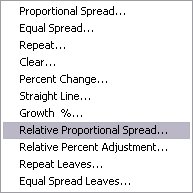
Choose Relative Proportional Spread in the menu:
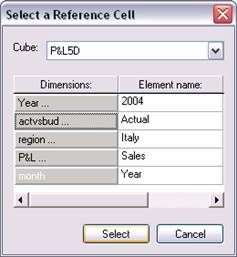
In the dialog you have to select the relative position. The reference cell can be located in the cube from which you initiate spreading or in a separate cube. The reference cell must, however, share the same exact consolidations as the cell from which you initiate spreading.
In our example we use the same cube.
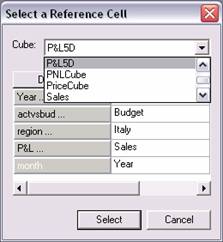
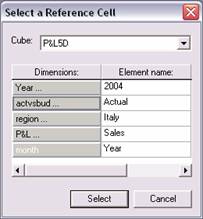
For every dimension you have to select a base value.
For the Year:
We want the distribution from the Year:
2004, Actual,
In this case the dialog looks like:

Enter the value to be spread in the Value field.
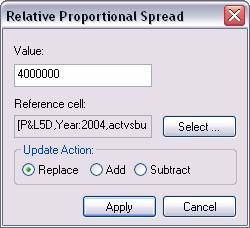
The value is spread like the values in Actual, .

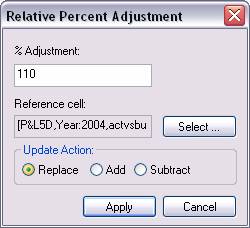
The Relative Percent Adjustment method spreads values to the leaves (children) of a consolidation by applying a percentage adjustment to the leaves of a reference cell.
We have the same initial situation as in the example 1.2.8.:

The reference cell is Year, Actual . Now we want to increase this value by 10% for the planning of Year, Budget while keeping the ratio in the months constantly.
Result:
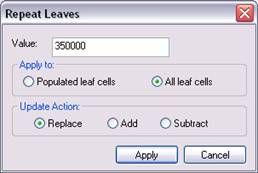
The Repeat Leaves method copies a specified value to the leaves (children) of a consolidation. When you apply this method, you can choose to copy the value to all leaves of the consolidation or only to those leaves already containing non-zero values.
Select the cell Year, Budget, 2005:
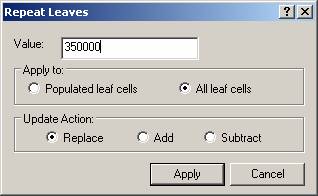
In every leave of the consolidation Year you now have .
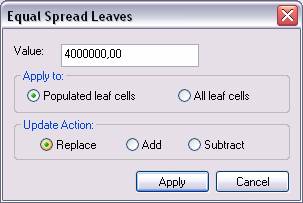
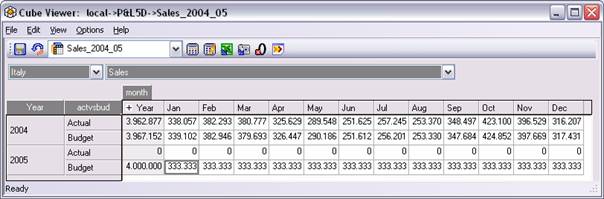
The Equal Spread Leaves distribution method is similar to the Repeat Leaves method. Now the value of the consolidation is distributed linearly on the leaves.
Select the cell Year, Budget, 2005:
TM1 includes a Leaf Hold feature that enables you to exclude cells from data spreading operations. The Hold feature can be used in the Cube Viewer, the In-Spreadsheet Browser, and slice worksheets.
Example:
Enter the values into the cells Apr, May and Aug, as shown below. The other cells should be filled by the Repeat Leaves method.
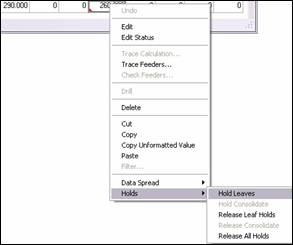
Step 1:
Select the cells that you want to hold. Choose Hold → Hold Leaves in the context menu
Blocked elements are indicated by a small red triangle in the bottom left corner.
![]()
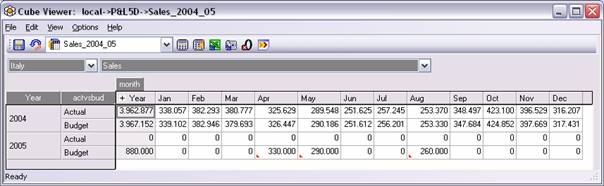
Step 2: Now use the Repeat Leaves method
Result:
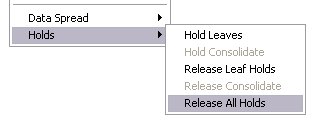
When you have finished the distributions you can Release All Holds.
Enter all planning values in Budget.
In the previous chapter we have explained the different data spreading methods available in TM1. Now solve following exercises on your own.
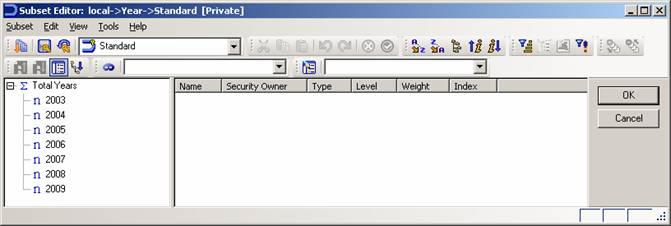
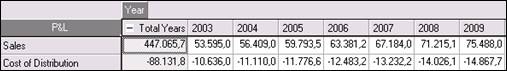
To create a five year planning, the dimension Year has to be expanded to the year .
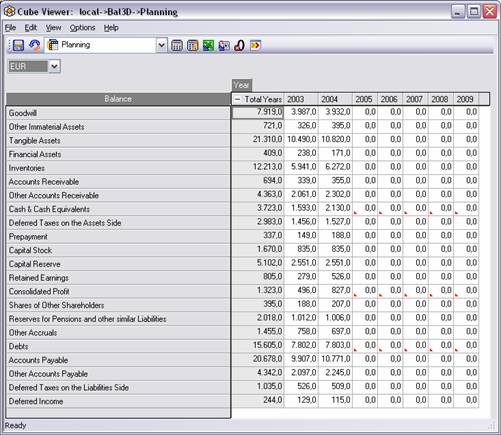
Create the view above and block the corresponding cells. You get the following result:
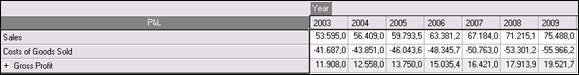
For planning we act on the assumptions that:
6% annual growth
![]()
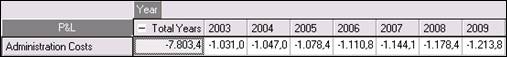
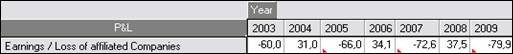
The margin improves 1% per year, therefore we only have a 5% growth (because the values are negative enter -5!)
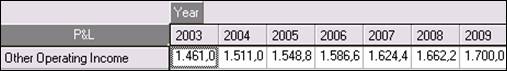
Increase linear up to 1.700,00 in
Grow proportional (base 2004 to the Sales
6% growth
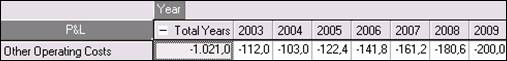
3% annual growth
Increase up to -200 in
Remain 0
In odd years add minus and in even years plus 10% to the basis.
a) Hold the even cells and plan the odd ones:
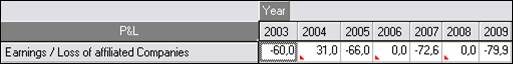
b) Hold the odd cells and plan the even ones:
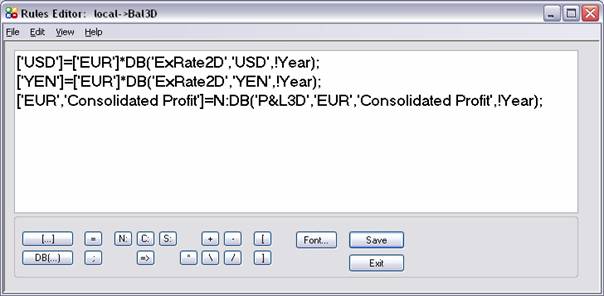
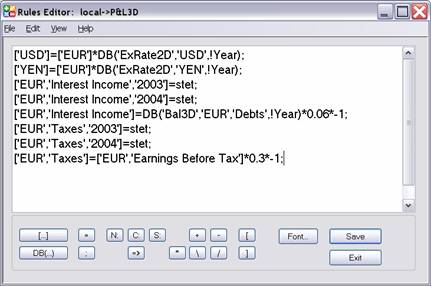
6% of Debts from Bal3D. Determine it by a rule:
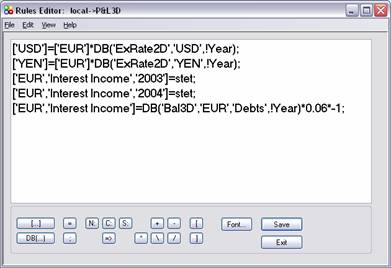
Attention to the algebraic sign!
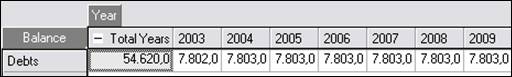
Repeat the leave of 2004 for the spreading of Debts for the balance sheet in Bal3D.
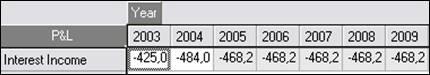
When we go back to P&L3D we have following values for the Interest Income.
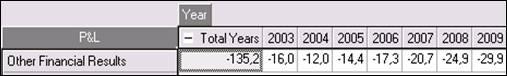
Other Financial Results
Deteriorate about 20% per year
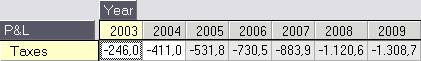
Taxes
30% of Earnings Before Taxes
Now our Taxes are spread as we can see in this screenshot:
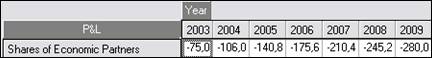
Shares of economic Partners
Decrease to -280 in
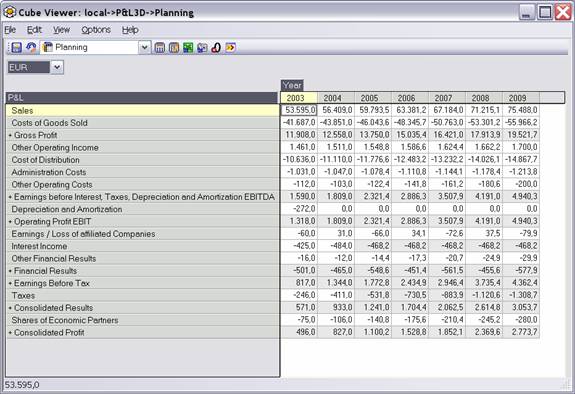
After Data Spreading our P&L3D should look like this:
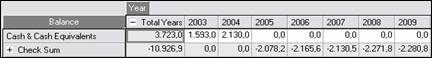
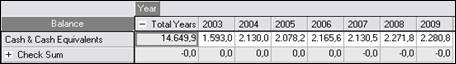
Enter the values from the check sum to the liquid assets
a) Before:
b) Afterwards:
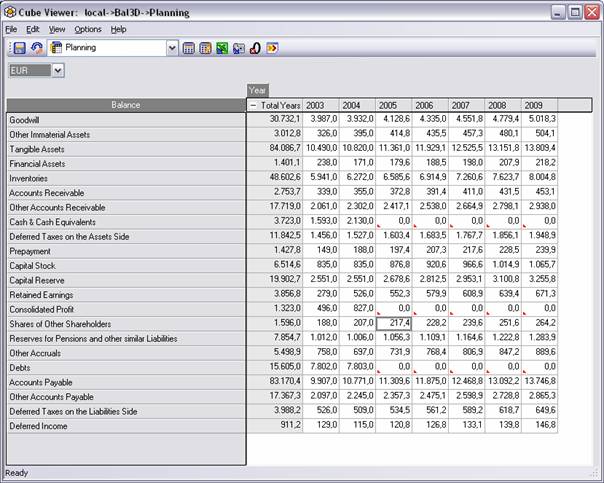
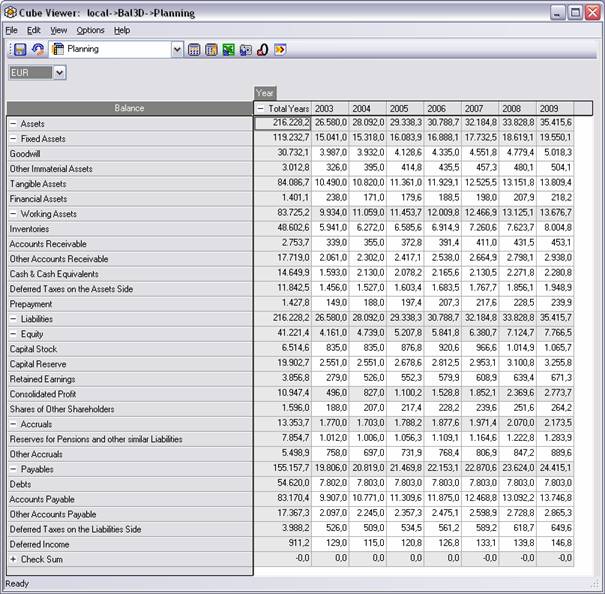
After Data Spreading Bal3D should look like we can see in the following screenshot:
Plan the values of the Sales cube in the year . Spread the values across the months according to the actual value in . Consider the following information:
No more sales worldwide
Method of resolution for point 1.:
Create following view: Sales2005
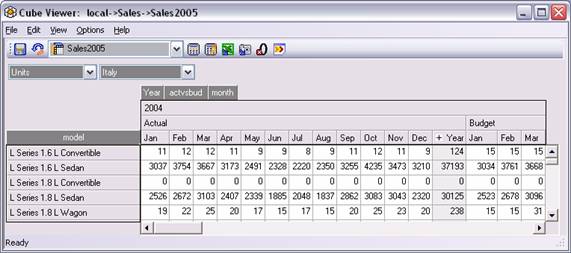
Copy the values from Actual 2004 to Budget 2005 without L Series 1.6L Convertible.
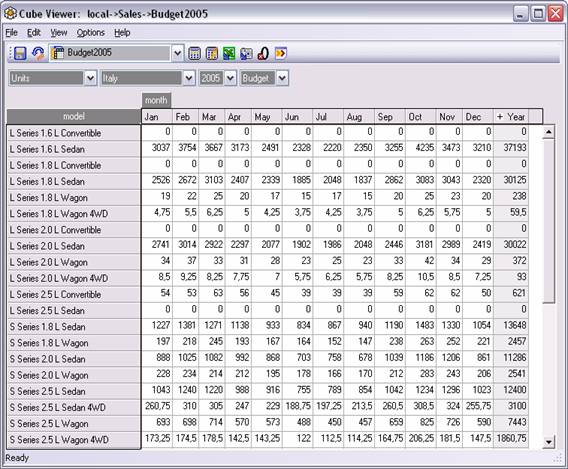
Method of resolution to point 2.:
Create this view: Budget2005
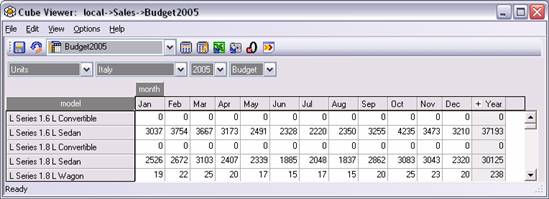
Revise the planning of the 4WD models according to the indications (25% of the 2WD models). Data Spreading Relative Percent Adjustment
You receive the following result:
Method of resolution to point 3.:
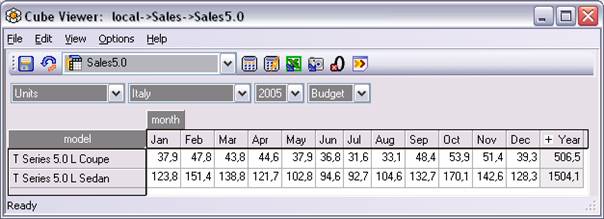
Create the view: Sales5.0:
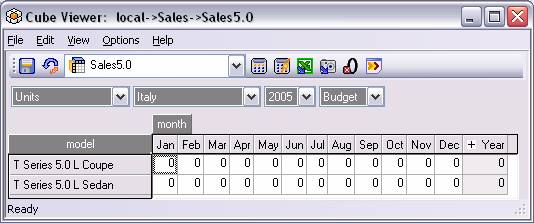
Modify the planning of the 5.0 models according
to the indications (10% of
Data Spreading Relative Percent Adjustment
(additional exercises)
Add the element
The 2WD models achieve 10% of
The 4WD models achieve 50% of the 2WD model's sales.
If necessary hold the cells of the Sales cube for
L Series 1.6 L Convertible
no more sales worldwide
The final result should match.
Transfer the planning data from the Sales cube for into the P&L5D via Excel Import sheet from module 3.
Use the planning value from the P&L3D cube from to distribute the data in the P&L5D cube according to the Sales spreading.
Check your results for the three cubes with the ISB-sheet from module 3.
|
